IV.1.3. Television audience analysis
IV.1.3.1. Television audience
The graph below will present the number of respondents who watch
television.

23%
77%
Yes No
Graphic 10. Distribution of the target according to
the television audience Source : Survey data, 2020
The proportion of our sample that watches television is 77%
versus 23% who do not watch television.
28
IV.1.3.2. Frequency with television
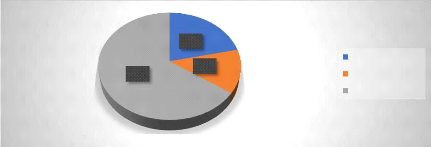
This graph only takes into account the proportion of our sample
that watches television.

65%
22%
13%
Monday to Sunday
Monday to Friday
Saturday to Sunday
Graphic 11: Frequency with television Source :
Survey data, 2020
65% of this proportion watches television from Saturday to Sunday
while 22% watches television from Monday to Sunday. Finally, 13% of the
indicated proportion watch television from Monday to Friday.
IV.1.3.3. Television viewing hours
The graph below shows the hours during which respondents watch
television.

29%
7% 4%
6 am-12pm
17% 12 pm-2 pm
6 pm-9pm
9 p.m.-12 a.m.
34%
Other (s) to be specified) Program function
9%
Graphic 12: Breakdown of the target according to
television viewing hours Source : Survey data, 2020.
This graph shows that 34% of respondents choose an audience
between 6 p.m. and 9 p.m., 29% of said respondents prefer to watch television
between 9 p.m. and 12 a.m. while 17% opt for 12 p.m. to 2 p.m. In addition, 09%
watch television from 6 a.m. to 12 p.m. while 07% watch television according to
other time slots and finally, 04% according to the programs broadcast.
29
IV.1.3.4. Audience rate of television channels
This graph allows us to discover the channels followed by the
proportion of our sample that watches television.

25%
16%
11%
9%
29%
10%
RTI 1
RTI 2
NCI
NOLLYWOOD
A+ IVOIRE
Other (s) to be specified)
Graphic 13: Breakdown by TV channels watched
Source : Survey data, 2020
Among those who say they watch television :
- 29% look at RTI1 ;
- 25% look at A + Ivoire ;
- 09% follows the NCI ;
- 10% look at RTI2 ;
- 11% for Nollywood and 16% for other channels.
IV.1.3.5. Audience rate of programs watched on
television
This graph allows us to discover the shows followed by the
proportion of our sample that watches television.

11%
8%
14%
26%
12%
29%
Serial
News
Sport
C'midi
Religion
Other (s) to be specified)
Graphic 14: programs watched on television Source
: survey data, 2020
30
Among those who say they watch television, 29% follow the news,
26% opt for sports programs, 12% prefer soap operas, 08% for C'midi, 11% watch
religious programs and 14% for other programs.
IV.1.4. Internet usage analysis
IV.1.4.1. Familiarity with the internet
The graph below shows the proportion of respondents who use the
internet.

99%
1%
Yes No
Graphic 15: Familiarity with the internet Source
: Survey data, 2020
The graph shows us that 99% of our sample uses the internet
compared to 1% who do not.
IV.1.4.2. Frequency of Internet use
Respondents who use the Internet connect at the following
frequencies.

2% 2%
96%
7 days a week
5 days a week
2 days a
week
Graphic 16: Frequency of Internet use Source :
Survey data, 2020
This graph shows us that among the people who use the
internet, 96% go online seven days a week (7 days a week) while 2% go online
five days a week (5 days a week) and the other 2% go on two days a week (2 days
a week).
31
| 


