IV.1.1.4. Geographic area of the study The coverage of
this study looks like this :
1% 1%
5%
17%
1%
1%
73%
1%
Campus INP-HB Yamoussoukro Abidjan Bouaké Toumodi
Zouan-Hounien France
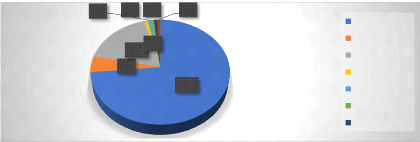
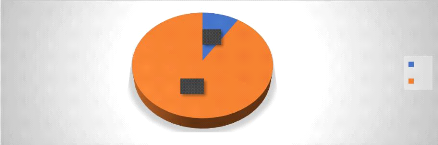
Graphic 4. Breakdown by geographic area Source :
2020 survey data
The geographic area most covered by our study is obviously the
INP-HB campus. In fact, 73% of the people who answered our questionnaire reside
on the Institute's sites. Then, the city of Abidjan covers 17% of the
responses. In addition, people who live in the city of Yamoussoukro
25
account for 5% of the responses. Finally, the least covered areas
are respectively Bouaké, Toumodi, Zouan-Hounien, Adzopé and Paris
(partner school of INP-HB) each with a rate of 1% of responses.
IV.1.2. Identification of the Polytechnic Language
Center IV.1.2.1. Notoriety of the Polytechnic Language Center
The percentage of individuals knowing the structure is as follows
:

76%
24%
Yes No
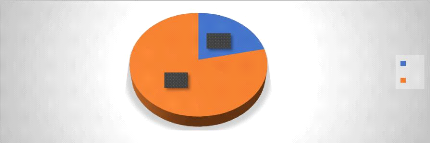
Graphic 5. Notoriety of the Polytechnic Language
Center Source : Survey data, 2020
The majority of respondents say they have never heard of the
Polytechnic Language Center with 76% of the responses. On the other hand, 24%
of individuals have already heard of the Center.
IV.1.2.2. Communication channels
The graph below shows the organization of the structure's
communication.
49%
Posters
1%10%
3% The present questionnaire
Word of mouth
37% WhatsApp
Facebook
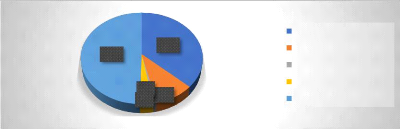
Graphic 6. Communication channels used by the
Polytechnic Language Center Source : Survey data, 2020
A large part of the people questioned say that they learned
about the Center thanks to our survey questionnaire. These represent 49% of our
sample. On the other hand, 37% of the respondents affirmed having known the
Center by word of mouth while the people who knew the Center
26
via WhatsApp made up 10% of the sample. Finally, the posters
allowed 3% of our sample to know the structure against 1% by Facebook.
IV.1.2.3. Geographic location
This graph breaks down the respondents according to whether they
know the geographical location of the structure.
78%
22%
Yes No
Graphic 7. Geographical location of the Polytechnic
Language Center Source : Survey data, 2020
Among those questioned, 78% did not know the geographical
location of the Polytechnic Language Center against 22% who said they knew its
location.
IV.1.2.4. Awareness of services
This graph answers the question of whether the respondents know
the services provided by the structure.
88%
12%
Yes No
Graphic 8. Notoriety of the services of the
Polytechnic Language Center Source: Survey data, 2020
Our sample consists of 88% of individuals who do not know the
services of the Language Center. However, 12% say they are aware of the
Centre's services.
27
IV.1.2.5. Attendance at the Polytechnic Language
Center
The attendance rate of the Polytechnic Language Center is as
follows:
91%
9%
Yes No
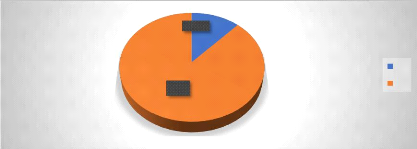
Graphic 9. Attendance at the Polytechnic Language
Center Source : Survey data, 2020
The attendance rate of the Center is very low, ie 09% of our
sample. A very overwhelming majority of the target never set foot within the
structure with 91% of the responses.
| 

