3.1.2. Movement and speed of gaseous molecules
The molecules of a gas have different speeds. During
their thermal movement, the molecules collide. As a result the magnitude and
direction of their speed change. The distribution of molecules according to
their speed is described by a statistical law. It is generally assumed that
this distribution follows Maxwell's law.
According to Maxwell, the number of molecules whose
absolute speed is between v and v + ??v
for any direction of motion is given by the equation:
|
m )3/2
f (v)
· ??v = 4??N
· (2??kTl
|
????2
??-2????
v2??v
|
(3.6)
|
32
This function allows us to determine the most probable
speed v??. The speed
v?? corresponds to the maximum of the
function f(v)and is determined by the
condition:
33
Chapter 3: Vapor deposition and thin layer
characterization techniques
?? ????2
????(?? 2???? ??2) = 0 (3.7)
Resolution of
(3.7) gives ????:
2????
???? = (3.8)
??
In the calculations, the most often we use the arithmetic
mean speed ??:
?? =v8???? = 1.128 ???? (3.9)
????
The root mean squared speed v??2 can also be
used:
v??2 =v3k??= 1.223 ???? = 1.08 ??
(3.10)
??
Figure 3.1 shows the molecule speed distribution for two
different temperatures;
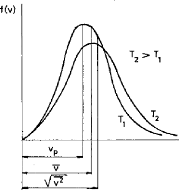
Fig.3.1 Function of gas speed distribution for two
different temperatures
The kinetic theory shows that each constituent of a
gas mixture has an independent speed distribution.
At great distances, the real molecules attract
themselves, while at smaller distances they repel each other. The number of
intermolecular impacts B can be calculated by the following
formula:
Chapter 3: Vapor deposition and thin layer
characterization techniques
?? = v2??????2?? = v2????2v 8??
?????? (3.11)
?? : The molecular diameter (if we consider the molecule as a
solid sphere). Finally we can give the mean free path ?? as:
|
?? =
|
1
=
v2????2??
|
????
v2??????2 (3.12)
|
34
This implies:
??
?? = (3.13)
??
The variation of the free mean path of some molecules with the
pressure is shown in figure 3.2.
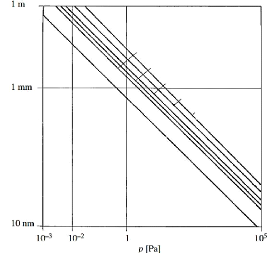
water vapor
nitrogen
oxygen, argon
Free mean path
oil
hydrogen helium
Fig.3.2 Free mean path of gas molecules as a function of
total pressure
3.1.3. Basics of vacuum technology
Each vacuum installation contains a chamber the vacuum is
obtained and maintained, a vacuum pump which evacuates the chamber and a piping
which connects them together. When the pump is switched on, the gas in the
chamber is directed towards the pump. The pump
35
Chapter 3: Vapor deposition and thin layer
characterization techniques
delivers the gas it contains. New quantities of gas from the
chamber replace the delivered gas and so on.
During pumping, the quantity of gas contained in the vacuum
installation decreases, its pressure obviously falls also because the volume
and temperature of the installation remain constants. In fact, the expansion of
the gas produces a lowering of the temperature, but because of the high thermal
inertia of the installation, it is considered that the gas temperature remains
constant.
During pumping the pressure decreases throughout the
installation, but the pressure in the chamber decreases more slowly than the
pressure at the suction port of the pump.
The variation in mass flow rat as a function of the number of
gaseous molecules passing through the section per unit time N is given by:
??= ?? · N' · ?? (3.14)
N': is The number of gaseous molecules
crossing a section in a time unit (m-2 · s)
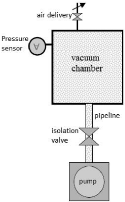
Fig.3.3 Principle of a vacuum installation
| 

