1.2.3. Corrosive wear
Corrosive wear is the friction removal of the reaction product
formed on the surfaces by chemical attack. Among these, we can site:
- Hydrochloric (HCl) and hydrobromic (HBr) acids, which
originate from the combustion of ethylene halides contained in the anti-knock
additive of leaded gasolines;
- Sulfuric acid (H2SO4), which comes from the cold
condensation of sulfuric anhydride (SO3) with the fuel combustion water in
engines operating with sulfur fuel, which is particularly the case for diesel
fuels.
- The organic acids coming from the partial oxidation of the
oil or the fuel, the shortest in length of organic chain are the most
corrosive. Corrosion is of particular concern when water and acids can condense
on metal surfaces, i.e. when the temperature of these walls is relatively low,
for corrosion to occur several conditions must be met:
- A corrodible metal (steel or antifriction alloy);
- A corrosive medium (aqueous electrolyte with a pH
sufficiently low to corrode the steel); - An intimate contact.
The corrosion can be eliminated by one of the following
methods:
- Elimination of sensitive metal (choice of a non-corrodible
alloy or an organic material);
- Placing a barrier between the metal and the medium;
In general, the first means of action is only rarely economically
or technically acceptable in the case
of internal combustion engines.
The second mean of action is specific to anti-rust and
anti-corrosion additives.
But the most useful way of protection is the coating (for more
information see the literature
review).
1.2.4. Fatigue wear
1.2.4.1. Fatigue fracture mechanism
By mechanical fatigue it is meant that the piston is subjected
to external variable loading. The resulting stress causes cracks to nucleate
and propagate in critical stressed areas. As shown in Fig 1.12, there are
mainly two stress critical areas where crack initiates: piston pin holes and
those regions on both sides of the bowl rim areas which are located on the same
vertical plane that contains the pin holes. It is also observed that there is
only one visible crack for mechanical fatigue.
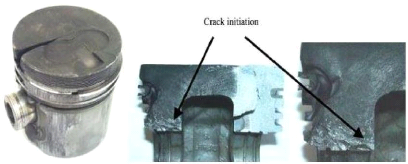
Fig.1.12: Gasoline engine piston with a crack from one side
of the pin hole to the head
14
Chapter 1: Overview on engine's piston
Under thermal fatigue, thermal gradients develop stress in two
ways. Thermal stresses due to the distribution of the temperature along the
vertical axis of piston - high temperatures at the top and lower temperatures
at the bottom - and that due to the different temperatures on the piston head
due to the flow of the hot air or fuel impingement. In the first case several
fatigue radial cracks over the whole piston head can be observed.
The cracks so formed gradually grow under the fatigue
conditions until it develops into a fracture on the crown. If severe enough,
fracture continues across the crown surface to have the piston sliced to
parts.
1.2.4.2. Fatigue damages to piston
Apart from piston crown, fatigue cracks are developed in other
parts of piston as well and it includes piston rings and piston skirt.
- Piston ring
As the wear on cylinder walls increases, clearance between the
piston and cylinder wall becomes high. Eventually, pressure acting on the ring
increases (because the ring comes out of the groove) and consequently stress
increase on the groove. The stresses at those fillet portions in the ring
groove seem to be sufficient to initiate fatigue cracks on the piston.
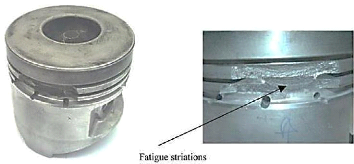
Fig .1.13: Engine piston with damaged grooves
In case the rings are not fitted correctly in the grooves, the
resulting misalignment stresses the ring material by the continuous
reciprocating motion. This will accelerates the fatigue crack propagation which
in turn stresses the ring lands and cause material to fracture away from the
ring land areas, as depicted in Figure 1.13.
- Skirt fracture
If the clearance between piston and cylinder becomes too
large, piston will be misaligned with cylinder, i.e., piston will be always at
an angle with the cylinder walls. This causes the piston to flutter within the
bore during the engine running. With larger clearances, the piston rotation
angle also increases and makes contact with cylinder walls at two points; the
bottom part of the skirt and the top part of the piston head. These contacts
introduce a flexural load on the piston skirt. The
15
Chapter 1: Overview on engine's piston
consequence will be the formation of stress concentration
areas where cracks initiate and propagate onto fracture, as shown in Figure
1.14.
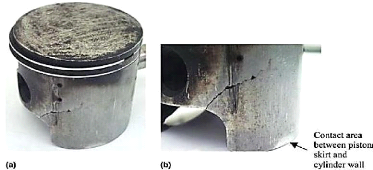
Fig .1.14: Initiation and propagation of cracks onto
fracture
1.3. Piston-cylinder Lubrication
1.3.1. The lubrication regimes in the piston-cylinder
couple
Based on studies made by several researchers, it can be confirmed
that:
- The main piston-cylinder lubrication regime is the hydrodynamic
regime;
-boundary Lubrication and sometimes dry contact occur in the PMB
and PMH areas, according to:
1. Courtney, Pratt, Tudor [PAN85] Using the measurement of
the contact resistance of the segments-cylinder;
2. Wing and Sauders [PAN85] from the study of the rapid
variations of the oil film thickness by adopting an indirect measurement of the
piston-cylinder diametral clearances;
3. Furuhama in 1959 [FUR59] after he noticed the
insufficiency of the hydrostatic lubrication which cannot explain a limit
lubrication of the segments with the TDC which possess in this position a zero
speed and consequently a zero film thickness;
4. Brown and Hamilton in 1975 [BRO76] by measuring the
pressure distribution in the oil film and the thickness of the film in the
vicinity of the TDC by capacitive proximity sensors. They demonstrated the
limiting lubrication of the segments in the vicinity of TDC and BDC
5. Allen and al in 1978 [ALL84] From the measured values of
the thickness of the oil film in the vicinity of the TDC, less than 0.25
ìm, they assert the existence of a metal / metal contact in these
zones.
6. Richez and al [RIC82] carry out tests on an engine and
show that the friction increases with temperature or with the decrease in
viscosity. The measurement of the amplitudes of the roughnesses (2 to 4
ìm) and the thicknesses of the oil film (0.5 to 10 ìm) enabled
them to demonstrate the existence of a metal / metal contact zone in the
vicinity of the TDC.
16
Chapter 1: Overview on engine's piston
7. Uras and Patterson [URA87] Measuring the friction force of
the piston and the measured friction force decreases as the piston velocity
increases. This frictional force also becomes important in the vicinity of the
TDC and BDC, indicating that the friction becomes limited in these regions.
8. Myers and al in 1990 [MYE90] Install capacitive gauges and
surface thermocouples to study the influence of different parameters on the oil
film in the vicinity of the TDC. They study the friction at engine start-up and
thus notice the breakage of the oil film which causes the metal / metal
contact.
- The boundary lubrication is located in the expansion and
compression cycles:
1. Rogowski in 1961 [ROG61] after measuring the
piston-cylinder friction force by means of a special device. He noticed that
this force becomes important during the compression and relaxation phase;
2. Furuhama and al in 1978 [FUR59] with the improvement of
their experimental set-up enabled them to show that the measured frictional
forces are very high in the second half of the compression phase and the first
half of the expansion phase at the TDC. The considerable increase in the
friction force confirmed the existence of a metal / metal contact between the
segment and the cylinder in these zones.
1.3.2. The main lubrication regime formulations in the
piston-cylinder couple 1.3.2.1. Formulation of Furuhama and
al
Experiments by Furuhama [RAY74] on driven engines and in
normal operation led him to state that the main mode of lubrication of the
piston and cylinder is of the hydrodynamic type. The Reynolds equation under
these conditions is written:
???? (h3
?? ?? · ????
????) = 6 · ???? · ??h ???? + 12 ??h
????
with h: oil film thickness, ?? :
Dynamic viscosity of lubricant, ??: Average hydrodynamic pressure, ????:
Speed of the piston.
The resolution of this equation makes it possible to determine
the pressure and velocity
distributions in the oil film.
1.3.2.2. Formulation of Richez and
al
Richez and al [RIC82] Introduce mixed lubrication of the segments
and take account of the surface
roughness. By noting that the heights of surface's roughness of
the segments and of the cylinder are
of the order of 2 to 4 ìm and that the thickness h of the
oil film is of the order of 0.5 to 10 ìm, they
define a factor ë= h /??, and proposed the criterion:
?? = 1 The lubrication is mixed;
?? = 1 The lubrication is hydrodynamic.
They also give the law of distribution of pressure and speed in
the oil film:
?? h3 ???? + ??h
???? (???? 12 ?? · ????
????) = ???2 ? · ??h ????
17
Chapter 1: Overview on engine's piston
???? = 1 - 0.9 exp (- 0.56 h
?? )
1.3.3. Generality on anti-wear additives (AW) in boundary
regime 1.3.3.1. Boundary regime and tribofilm
Lubricating oil consists of one or more base oil which
represents the framework of the product. However, for certain applications, and
particularly at high temperatures and pressure (as in the case of pistons), the
base oil is no longer efficient. In order to meet the various uses, multiple
and different additives are added, specific to each use. Among the main types
of additives are anticorrosive, anti-oxidation and anti-wear (AW) dispersant
additives. These additives influence the behaviour of the lubricant by
reinforcing its properties or by adding it others of which it is devoid;
Researchers in the field of lubrication develop different
laboratory tests and each test fulfils a given function. These tests are
Interesting on the mode of application or the behaviour of the lubricant. The
formulation of lubricants requires control of the functioning of each additive
(its reactivity to the metal surface and its mode of action) and their impact
on the environment [TAN07].
In order to improve the performance of the lubricants in
boundary regime in order to avoid seizure and to have reasonable friction,
additives and in particular anti-wear additives (AW) and extreme pressures (EP)
are incorporated in them. These compounds act directly on the metal surface by
forming a protective film on surfaces called tribofilm by chemical reaction or
physical adsorption.
Tribofilms formed in the boundary lubrication regime are
designed to reduce friction and to protect the surface from wear due to
lubricant/surface chemical reactions induced by temperature and pressure
conditions.
Boundary lubrication is a complex phenomenon in which several
parameters intervene such as solid-lubricant interactions, metallurgy,
roughness, corrosion, temperature, pressure and kinetics of chemical
reactions.
In the limit lubricating regime, the height of the surface
roughness becomes greater than the thickness of the film at the interface, the
oxide layer which protects the surface is removed and the two surfaces are
brought into contact. This situation causes wear, increases friction and can
cause welding of the roughness. The viscosity of the oil no longer intervenes
under these extreme conditions, it is the additives present in the oil which
will interact chemically with the metal surfaces to form the tribofilm whose
thickness is a few tens of nm and which protects the Parts against wear
[GEO79].
The additives (AW) by forming their own sacrificial film
replace the oxide protective layer and considerably reduce the wear rate.
1.3.2.2. Types of anti-wear additives
(AW)
The additives (AW) are classified according to their
reactivity with respect to the metallic surface in two types, the active
additives and the non-active ones [PAP98]. The active additives are those which
chemically react with the metal surface to form a film. On the other hand, the
non-active additives form films which are mainly unreacted with the surface.
18
Chapter 1: Overview on engine's piston
Molecules that contain sulfur, phosphorus and halides are
considered active compounds while molecules containing boron, aluminum and
graphite are classified as non-active compounds [DON94].
Table 3.1 shows the main anti-wear additives (AW) used in
lubrication.
|
Additive Families
|
|
sulfuric additives
|
dialkyldithiophosphates of zinc ZnDTP
|
|
2-benzothioyle-tert-nonyle disulfur
|
|
Phenyle sulfur
|
|
Benzyle mercaptan
|
|
Octadecyle mercaptan
|
|
Dodecylebenzylemercaptan
|
|
Ditert-octylemercaptan
|
|
Phosphoric
additives
|
Alkyl d'acide phosphoré
|
|
Alkyl phosphoré
|
|
Phosphites
|
|
Borate
Additifs
|
Esters boratés
|
|
Borates de potassium
|
|
Borates de calcium
|
|
mixed Additifs
|
Dithiophosphates métalliques (Zn,Co,Ni,..)
|
Table 3.1.The main anti-wear additives (AW) used in
lubrication
The universally used additives (AW) are
dialkyldithiophosphates and zinc (ZnDTP). This success is mainly due to its
good antioxidant and anti-wear properties and its low cost [TAN07].
Several authors have shown that the chemical structure of
sulfur-containing additives affects tribological performance, for example.
Disulfides have been shown to perform better in anti-wear AW than monosulfides
due to weak S-S bond in disulfides which is Easier to break than the C-S bond
in monosulfides [FOR70].
Croszek [GRO71] Considers that the anti-wear (AW) activity of
the disulfides depends on the electronegativity between the chemical elements
of this molecule.
19
Chapter 1: Overview on engine's piston
Sakuraia Has shown that oxygen in oil plays an important role
in the formation of oxide films and appears to have a good influence on
tribological behavior [FEN61]. From the chemical reactivity of some additives,
he concluded that oxygen and oxide films prevent wear on surfaces and reduce
friction.
Wheeler [WHE78] differentiates two types of wear: soft wear
and severe wear. Under severe pressure and temperature conditions, a
significant amount of iron sulfide is detected in the wear traces in comparison
with the mild pressure and temperature conditions, and concluded that under the
effect of the elevation of Temperature and pressure, the sulfur compounds react
by chemical corrosion with the metal surface to form iron sulfide.
Temperature affects the tribological behavior of sulfur
additives and the formation of tribofilms. Temperature seems to have a limited
effect on the decomposition of sulfur additives by promoting the formation of
iron sulfide films which improves tribological performance [TAN07].
Chapter 2
Aluminum and its alloys
22
Chapter 2: Aluminum and its alloys
2.1. Properties of non-alloyed aluminum (1000
series)
There are many grades of unalloyed aluminum, known
commercially as pure aluminum. These standard grades are part of the 1000
series of AFNOR standards. The purity of aluminum is always greater than 99.00%
(grades 1100 and 1200), very often higher than 99.40% (grade 1040), but can
reach 99.80% (grade 1080) or even 99.90% (grade 1090).
It is also possible to obtain a high purity aluminum of 99.95
% (grade 1095), 99.98 % (grade 1098), 99.99 % (grade 1199), and even an
aluminum of very high purity (greater than 99.996%, or even equal to
99.999%).
The structure of the pure aluminum is face-centered cubic at
any temperature below its melting point (660 °C). The main physicochemical
properties of unalloyed aluminum are given in Table 2.1: (At 20 °C for a
pure aluminum of 99.996%):
|
Melting temperature G??
|
660°C
|
|
Crystal structure
|
CFC
|
|
Density ??
|
2700 Kg/??3
|
|
Thermal conductivity ??
|
237 ????-1k-1
|
|
Coefficient of linear expansion ??
|
23.1x 10⁻⁶ k-1
|
|
Electrical resistivity ????
|
0.0265 ??????
|
Table 2.1: Physicochemical properties of unalloyed
aluminum
These properties are the reason why the unalloyed aluminum is
widely used (in developed countries more than 40% of the aluminum consumption
takes place in this state).
Table 2.2 gives the main mechanical properties of unalloyed
aluminum:
|
Ultimate tensile strength ????
|
40 à 50 MPa
|
|
Yield strength Re
|
10 à 20 MPa
|
|
Proof stress Re0.2
|
20 à 35 MPa
|
|
Young's Modulus E
|
63 à 71 GPa
|
|
Elongation to rupture A%
|
50 à 70%
|
|
Poisson's ratio õ
|
0.33 à 0.35
|
Table 2.2: Mechanical properties of unalloyed
aluminum
2.2. Aluminum alloys
The main alloying elements introduced into aluminum are
copper, manganese, magnesium, silicon, zinc and lithium. These elements can be
added individually or in combination. On the opposite, certain other elements
are more or less excluded, in order to improve a particular property. For
example the tenacity of alloys with magnesium and silicon is greatly improved
by additions of manganese and chromium with limited contents (often Cr <0.4%
and Mn <1%) and by a severe limitation of the contents of harmful elements
such as iron.
23
Chapter 2: Aluminum and its alloys
2.2.1. Classes of aluminum alloys
The aluminum alloys are classified according to the main alloying
element (s). We can
distinguish:
- Aluminum/copper alloys of the 2000 series;
- Aluminum/manganese alloys of the 3000 series;
- Aluminum/silicon alloys of the 4000 series;
- Aluminum/magnesium alloys of the 5000 series;
- Aluminum /magnesium/silicon alloys of the 6000 series;
- Aluminum/zinc alloys of the 7000 series;
- Aluminum alloys and other elements of the 8000 series.
We can also distinguish:
- Peening alloys (not hardening by heat treatment): which are
aluminum/manganese alloys and
aluminum/magnesium alloys;
- Heat treatment hardening alloys: which are aluminum/copper
alloys, aluminum/magnesium
alloys, aluminum/silicon alloys and aluminum/zinc alloys.
2.2.2. Physical properties of aluminum alloys
Table 2.3 gives the main physical properties of the different
series of aluminum alloys (the mean value of different experimental results are
considered):
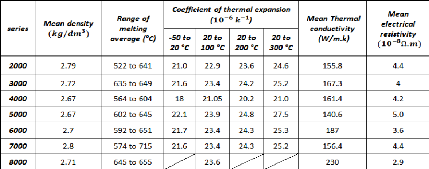
Table 2.3: Physical properties of the different series of
aluminum alloys
2.2.3. Mechanical properties of aluminum
alloys
It is well accepted that the properties of aluminum alloys are
determined essentially by the microstructure of the alloys obtained.
The microstructure is essentially conditioned by the nature,
the quantity and especially the distribution of the elements of addition. Most
metallic elements can be alloyed with aluminum, but only a limited number of
those elements are used as the main addition and condition the properties of
the alloys.
24
Chapter 2: Aluminum and its alloys
Table 2.4 below represents the mean values of the mechanical
properties for different series of aluminum:
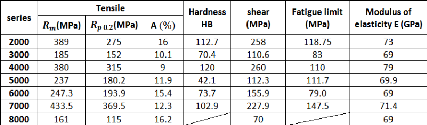
Table 2.4: Principal mechanical properties of different
series of aluminum
2.2.3.1. Static strength
Table 2.4 gives the mechanical strength obtained for each of
the series of aluminum alloys. In fact, those characteristics can be varied
depending on many factors.
2.2.3.2. Tenacity
Three categories of aluminum alloy can be considered on the
tenacity point of view:
- Tenacity of low- and medium-strength alloys: those alloys are
of 1000, 3000, 5000 series and
all of other series in the annealed state;
- Tenacity of alloys of the 6000 series: Al-Si-Mg alloys with
medium resistance of the 6000 series
are commonly used for working structures;
- Tenacity of high strength alloys: those alloys are of 2000 and
7000 series.
For the high strength alloys, it can be noted that:
- The tenacity increases when the yield point decreases.
- The newest alloys currently used for the construction of modern
structures of aircraft are
designed to offer a particularly high tenacity:
? The 7475 is the aluminum alloy which has the best tenacity;
? The alloys 7010, 7050, and 7150 offer the best compromise
between strength and
tenacity.
2.2.3.3. Endurance strength
The Wohler curves of aluminum alloys have the following
characteristics:
- There is no asymptote up to 108 cycles, so the
fatigue test must be kept running up to 108 cycles to determine the
fatigue limit;
- The ratio between the fatigue limit at 108 cycles
(in alternating stresses) and the tensile breaking limit is equal to:
- 0.35 to 0.45 for Peening alloys (1000, 3000 and 5000 series
alloys);
- 0.25 to 0.35 for heat treatment hardening alloys (2000, 6000
and 7000 series alloys); In general, this ratio decreases when the breaking
load increases. Different parameters can influence the rate of fatigue
cracking:
25
Chapter 2: Aluminum and its alloys
in
- The stress ratio R = Sm : the rate
of fatigue cracking increases when R increases;
- The medium: humid or salty aggressive medium
accelerates fatigue cracking;
- Overloads: during a fatigue test, if the stress
intensity factor is temporarily increased by a tensile overload, a significant
reduction in the rate of cracking is observed after suppression of the
overload.
2.2.3.4. Corrosion resistance
In practice, aluminum has an excellent corrosion
resistance, because of that it can often be used without coating. Adequately
chosen, aluminum alloys without coating can resist to freshwater, sea water,
and so many chemical products.
However, like the most common metals, corrosion damage
can occur in different forms, depending on the class of the aluminum alloy, its
metallurgical state, the exposure conditions, assembly and stressing
conditions.
The principal forms of corrosion that can be
encountered on aluminum alloys are:
- General corrosion or uniform
corrosion
The exposed aluminum instantly covers with an oxide
layer of 5 to 10 nm thick, and its corrosion resistance depends on the
stability of this oxide layer in the corrosive medium. General corrosion is
characterized by the uniform decrease of thickness over the entire metal
surface; the oxide layer is dissolved in a regular manner by the corrosive
agent.
In a natural, rural or marine atmosphere, the
corrosion rate of aluminum is extremely low, even insignificant, and does not
exceed 5 pm / year. In general, the general corrosion resistance of aluminum
depends on the pH of the corrosive medium, that corrosion cannot practically
occur in an acidic medium with pH <4 and in a basic medium with pH>
9.
In the most aggressive mediums such as marine mediums,
copper-containing alloys (2000 and 7000 series) require protection; On the
other hand, the alloys of the 3000, 5000 and 6000 series may have a corrosion
resistance at least equal to that of the non-alloyed aluminum.
- Pitting corrosion
Pitting corrosion is a much localized form of
corrosion, which appears by the formation of cavities or recesses on the
surface, in which the diameter and depth depend on the class of the alloy, the
corrosive medium and the exposure time.
The rate of deepening of the pits generally decreases
due to the formation of hydrated alumina which hinders considerably the
exchanges between the corrosive medium and the metal. Experiments show that the
rate of propagation of pits v is related to time t by a
relation of the type:
V= k
· t1/
3
All the aluminum alloys are sensitive to pitting
corrosion, the best results being obtained with a content of 1% of iron (it is
the case of alloys 8006, 8011 for example), likewise the presence of 0.1 to 0.2
% of copper improves the resistance for the penetration of pits (the case of
alloy 3003).
26
Chapter 2: Aluminum and its alloys
- Galvanic corrosion
When two different metals are in electrical contact in a
corrosive medium, they form a cell which produces current by consuming the most
electronegative metal which constitutes the anode. Aluminum is the most anodic
material compared to other metals (except zinc and magnesium). Aluminum will
therefore often be the victim of mixed assemblies.
In fact, the attack rate of aluminum depends on: the
difference of potential between the two metals present; on the electrical
resistance between the two metals and on the corrosive medium and more
particularly on its conductivity.
- Corrosion cracking or Intergranular corrosion
The intergranular corrosion encountered in various metals and
aluminum alloys is the corrosion that propagates in the metal by consuming only
the grain boundaries. This type of corrosion is due to the presence at the
grain boundaries of a continuous and anodic zone compared to the interior of
the grains.
For aluminum alloys, it mentioned that:
- Alloys of 1000, 3000, 4000 and 6000 series: are not sensitive
to intergranular corrosion;
- Alloys of the 5000 series: Al-Mg alloys with less than 3.5%
Mg are normally not susceptible to intergranular corrosion and Al-Mg alloys
with more than 3.5% Mg may be sensitive to intergranular corrosion especially
if the magnesium content is high;
- Alloys of the 2000 and 7000 series: have a good resistance
to the intergranular corrosion obtained by a quick quenching.
2.2.4. Standards defining aluminum alloys 2.2.4.1.
Wrought aluminum alloys
This family of aluminum alloys is the most widely used in
industry. It includes all commonly
rolled products.
The NF EN 573 standard defines two European systems for the
designation of these aluminum
alloys: the numerical system and the alphanumeric system.
The numerical system uses a 4-digit code which refers indirectly
to the chemical composition.
According to this system the designation of an alloy includes
successively:
4 letters: EN AW
EN refers to European standards;
A indicates that it is aluminum;
W specifies that it is wrought metal.
4 digits:
The first digit indicates the series of alloys
The second digit can be:
- 0 if it is the original metal,
- 1 to 9 if the alloy has certain particularity (purity of a
unalloyed aluminum, variant of an alloy,
etc.);
27
Chapter 2: Aluminum and its alloys
The third and fourth digits have different meanings depending on
whether they are:
- Of unalloyed aluminum; they are then the first two decimal of
the number expressing the
minimum Al content,
- Of an alloy: these two numbers serve only to differentiate the
grades of the same group.
Examples:
EN AW-1098 = aluminum with at least 99.98% purity;
EN AW-4015 = alloy wit 1.8% of Si and 0.9% of Mn;
In the alphanumeric system, unalloyed aluminum and aluminum
alloys are distinguished. For
the unalloyed aluminum, the designation begins with the chemical
symbol of aluminum Al
followed by the minimum content of the metal in % expressed in
one or two decimal.
Example: EN AW-Al 99.98 = Aluminum with at least 99.98%.
Normally this designation should be preceded by a numerical
designation and the minimum
content of the metal in % placed in brackets, the precedent
example is designed as EN AW-1098
[A 99-98].
For aluminum alloys, the designation begins with the chemical
symbol of aluminum Al,
followed by the chemical symbol (s) of the main alloying element
(s), each followed by a number
representing the average content in % of the indicated
element.
Examples:
Al Si2Mn = alloy of 1.8% of Si and 0.9% of Mn;
Al Si10 = alloy of 10% of Si.
Normally, this designation should be preceded by the numerical
designation and be placed in
brackets such as the following:
EN AW-4015 [AlSi2Mn];
EN AW-4045 [AlSil0];
2.2.4.2. Cast alloys
Most of these alloys are easy to mold (permanent mold or sand
casting). Many of these alloys contain sufficient silicon to cause a eutectic
reaction, which gives the alloys a low melting point, good fluidity and good
molding. The cooling in the die casting is faster than sand casting, which
results a grain refinement and improved mechanical properties. Grain refinement
is also caused by boron and titanium additives.
Designation according to the standard NF EN 1780, is given as:
prefix EN; space ; Letter A (for aluminum); Letter B (for remelting ingots) or
C (castings piece) or M (mother alloys); A dash ; followed by five digits
representing the position of the chemical symbols giving the composition of the
alloy ordered by decreasing content and limited to 4 elements.
Example:
EN AB-45400 [Al Si5Cu3] or EN AB-Al Si5Cu3; remelting ingots
in aluminum alloy with 5% silicon and 3% copper.
28
Chapter 2: Aluminum and its alloys
2.3. Aluminum-Silicon Alloys (4000 series)
The equilibrium diagram of the Aluminum-Silicon alloy is given in
Figure 2.1.
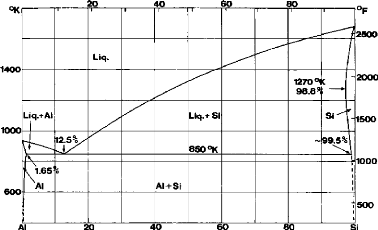
Fig.2.1: The equilibrium diagram of the Aluminum-Silicon
alloy
The eutectic point varies from 11.7% Si to 14.5% Si. The most
probable value is 12.5% Si. With rapid quenching the eutectic point can rise to
17% Si.
The main physical and mechanical properties of
aluminum-silicon alloys have been given in Tables 2.3 and 2.4.
Hardness increases with increase in silicon content almost
linearly and reach values between 500 and 700 MPa for 15% Si and 1000 MPa for
60% Si.
The modulus of elasticity has an average value between 85 and
95 GPa, this value increasing with temperature. The impact resistance also
increases with increasing temperature.
The endurance strength is relatively low; it varies from 50 to
70 MPa for the hypoeutectic alloys and from 70 to 80 MPa for the hypereutectic
alloys. The addition of cobalt and manganese increases the endurance strength.
This strength abruptly decreases with the temperature increasing until 327
° C.
The compression strength is 10 to 15% greater than the tensile
strength.
The wear resistance is very good, especially for hypereutectic
alloys. For alloys of 20 to 25% Si, the wear resistance is 10 times more than
that of the non-heat treated steel.
The presence of calcium and sodium in the alloys increases
their porosity. To reduce it, rare earths are added. Vacuum coatings are also
used.
The silicon is an inert element in most corrosive mediums, the
corrosion resistance of the aluminum-silicon alloy is the best compared to
other aluminum alloys.
The coefficient of thermal expansion is relatively low
compared to other aluminum alloys; it is decreased with the increase in silicon
content.
29
Chapter 2: Aluminum and its alloys
According to Table 2.5 it is noted that the coefficient of
thermal conductivity is decreased with the increase of the Silicon content.
|
Silicon content (%)
|
Temperature (K)
|
|
300 à 400
|
300 à 600
|
|
5
|
22.1 à 22.5
|
24.1 à 24.5
|
|
7 à 9
|
21.4 à 21.7
|
23.1 à 23.5
|
|
12
|
19.9 à 20.6
|
21.6 à 23.1
|
|
> 14
|
18 à 19
|
20 à 21
|
Table 2.5: Coefficient of the thermal conductivity
(10-6 K-1)
The alloy density is decreased with the increasing in Silicon
content. An alloy of 6 to 9% Si has a density of 2650 to 2700 ????/
??3 and with 10 to 13% Si has a density of 2600 to
2650????/??3.
Chapter 3
Vapor deposition and thin layer
characterization techniques
31
Chapter 3: Vapor deposition and thin layer
characterization techniques
3.1. Physical bases of the vacuum technique 3.1.1.
Vacuum and gaseous phase of the materials
Materials in the gaseous state are characterized by a
great mobility of their molecules. Because of this; they always occupy the
volume of the container in which they are enclosed. In physics and technology,
we call vacuum, the state of a gaseous volume whose pressure is below the
atmospheric pressure. For convenience, vacuum is divided into four ranges: low
vacuum, fine or medium vacuum, high vacuum, and ultrahigh vacuum.
Table 3.1 gives the general characteristics of
vacuum:
|
characteristics
|
Vacuum
|
|
Low vacuum
|
Medium vacuum
|
high vacuum
|
ultrahigh vacuum
|
|
Pressure range (bar)
|
1 à 10-3
|
10-3 à 5 · 10-5
|
·
5 1012 a
|
< 10-12
|
|
Number of molecules in
?? ??????
|
1019 à 1016
|
1016 à 1013
|
1013 à 1010
|
1010
|
|
Mean free path ??
|
A « ??
|
A = ??
|
A > ??
|
A » ??
|
|
Flow regimes
|
Viscous flow
|
intermediate flow
|
molecular Flow
|
Molecular Flow
|
|
Application
|
Packaging,
drying
|
CVD, plasma
|
PVD
|
Ion beams
|
Table 3.1 General characteristics of
vacuum
According to kinetic theory, the molecules of a gas
move in a continuous and chaotic manner. They collide and between their impacts
their movement is rectilinear. The distance between two successive impacts is
called the free path of the gas molecule. After each impact, the magnitude and
direction of the velocities of the molecules change.
When the gas occupies a limited volume, there are
molecular impacts on the walls of the container. So the gas pressure is the
result of the statistical mean of these impacts.
A general criterion characterizing the vacuum in a
system is the ratio of the mean free path ë of the molecule with a
characteristic dimension ?? of the vacuum chamber, that is to
say:
A
Kn = (3.1)
??
The Kn ratio is known as Knusden
number, when Kn » 1, i.e. X » l the
flow regime of the gas is molecular flow. When Kn « 1,
i.e. X « l the regime is called viscous flow.
The limiting temperature above which the gas cannot be
condensed, whatever the pressure, is called the critical temperature. This is a
fundamental criterion for distinguishing gases from vapors.
Chapter 3: Vapor deposition and thin layer
characterization techniques
Materials are in the gaseous state if the temperature
is above their critical temperature. If the temperature is below their critical
temperature, they are in the vapor state.
The pressure can be written in the form of the following
equations:
P= ??
· k
· T (3.2)
?? : The number density of the molecules
(m-3);
k : The Boltzmann constant (k 1.38
· 10-16 N
· m/K); T
: The gas temperature.
1
P = 3 ??v2 (3.3)
?? : The density of the gas (kg
· m-3);
vv2 : The-root-mean-square speed of
molecules.
When the gas system is a mixture of different gases,
each gas exerts its pressure Pi independently of the
others. The total pressure PE is then the sum of the
partial pressures (Dalton's law):
i=??
PE = ?Pi (3.4)
i=1
According to the kinetic theory, the mean kinetic
energy of the translation of molecules is proportional to the thermodynamic
temperature of the gas:
|
m
· v2
|
3
2
· k
· T (3.5)
|
|
2
|
| 

