Pour l'assurance non-vie nous choisissons
d'investir selon l'allocation proposée dans le deuxième
scénario, en effet un coefficient de variation de 14%
contre celle des 30% pour le premier scénario.
15
TABLE DES FIGURES

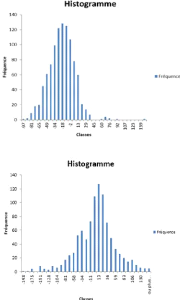
FIGURE 3 - Distribution des NAV selon
les deux scénarios
Pour l'assurance vie on choisi
également le deuxième scénario, ce choix est motivé
par la valeur du NAV de 93,01 contre -12,08,
ce choix est renforcé également par une
interprétation graphique en effet la première distribution est
plus aplati par rapport à la deuxième ce qui implique que notre
investissement est plus risqué et plus étalé ainsi on peut
expliquer aussi ce choix par la volatilité élevée du
marché donc les assureurs recourent vers les obligations pour se
couvrir.
Les résultats réalisés n'impliquent pas
de se limiter aux décisions fournies par le code, en effet :
· Un modèle est l'outil d'approximation et d'aide
à la décision, certes son utile mais reste est limité : on
peut renforcer le choix par d'autres outils
· Un assureur est exposé aux différents
risques, il n'est pas évident de corréler entre eux : on peut
modéliser des corrélations au sein d'un GSE par les
méthodes des vraies semblances et les copules
· Mesurer les différents degrés d'aversion
de risque : utiliser les fonctions d'utilité (Von Neuman Morgenstein)
16
Synthesis note
1. Introduction
Asset-liability management constitutes an organizational
manual in insurance companies for measuring, analyzing and managing the risks
inherent in the activity.
A forward-looking view of this fact becomes essential in
order to ensure sufficient capital to meet future commitments. In life
insurance, savings contracts provide for a certain number of financial
guarantees such as the TMG, revaluation rate in return for a
premium and risks such as mortality and redemption for to do so, the insurer
must:
· Prevent an investment strategy.
· Set an optimal allocation of these interest
generators.
· Treat his assumptions under different scenarios so
that he is capable for any deviation from the market.
In non-life insurance, the premium paid must fully cover the
risk taken out, in particular risks that last in the long term such as
annuities following bodily injury in the automobile or annuities following a
medical error in health insurance in this context. the insurer must study:
· The different financial scenarios, allowing to choose
one of the different managed asset allocations according to the S / P ratio.
· The impact of changing the S / P ratio.
· The impact of excess claims.
Insurance companies are therefore highly dependent on the
economic situation of the market, this factor is an inherent element of the
activity since the insurer is committed to:
· Provide active-passive interaction.
· Choose an optimal asset allocation that meets the
needs of policyholders and shareholders.
· Respect a regulatory and accounting framework.
Hence the need for an ALM (Asset Liability Management) model
in order to project the flows of assets and liabilities and forecast the
evolution of the activity of the company in the long term.
2. Une analyse des résultat obtenus
We are working on both sides of insurance: life and non-life
insurance with the aim of providing decision support tools.
17
TABLE DES FIGURES
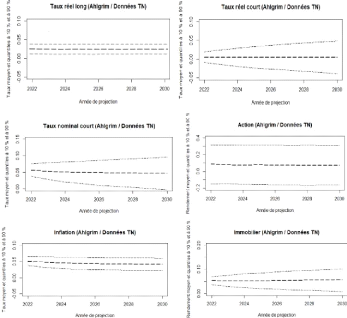
We begin to project our macroeconomic variables: the
inflation index, the stock yield, the real estate yield, the real long rate,
the real short rate and the nominal and real zero-coupon prices.
This projection constitutes the driving force of this thesis
entitled "Application of the generators of economic scenarios in ALM
for the insurance companies", it is ensured as indicated by its name
by the GSE in particular the reference model AHLGRIM et al . : a model which
requires data available at the level of the Tunisian market of which the latter
responds to the constraint that it requests singled out compared to the other
model (WILKIE, BRENNAN AND XIA in our study) by the real estate index which
constitutes a pillar of investment in Tunisian insurers and simplicity of
implementation. We obtain the following results:

These outputs are used in the following for :
· Project the balance sheet, the
technical income statement and cash flow
statement.
· Calculate the Best Estimate and the
NAV.
· Analyze the different asset
allocations.
18
TABLE DES FIGURES
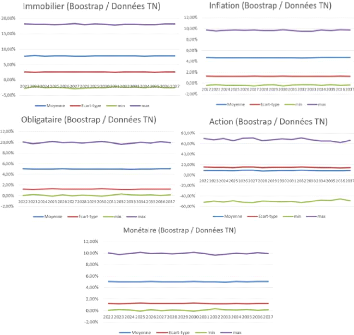
For the projection (in non-life insurance), we rely on
boostrapping techniques in order to resample a new scenario
each time.

In non-life insurance, we have analyzed the evolution of own
funds according to two economic scenarios, the distribution of the first of
which is defined by: 15% in money market, 15% in equities, 10% in real estate
and 50% in bond.
The allocation proposed for the second scenario is as
follows: 20% in money market, 30% in equities, 20% in real estate and 20% in
bonds.
For life insurance we find the following two histograms of the
NAV distribution: The first scenario of which is defined by the following
allocation:
· 80% in equity.
· 20% in bounds.
For the second scenario, we propose the opposite case (80 %
in bonds and 20 % in shares (curve below)).
3. Conclusion
For the non-life insurance we choose to
invest according to the allocation proposed in the second scenario, in fact a
coefficient of variation of 14 % against that
of the 30 % for the first scenario thus this choice is
reinforced by a graphic interpretation: equity at the end of the period is
higher than the first amount invested at the initial.
19
TABLE DES FIGURES

For the life insurance we also choose the
second scenario, this choice is motivated by the value of the NAV of
93,01 against -12,08, this choice is also
reinforced by a graphic interpretation in fact the first distribution is more
flattened compared to the second which implies that our investment is more
risky and more spread out so we can also explain this choice by the high
volatility of the market therefore the insurers resorts green bonds to
hedge.
The results achieved do not imply limiting oneself to the
decisions provided by the code, in fact:
· A model is an approximation and decision-aid tool,
certainly useful but these are limited: we can reinforce the choice by
other tools.
· An insurer is exposed to different risks, it is not
easy to correlate between them: we can model correlations
within a GSE by the likelihood methods and
them copulas.
· A person averse to risk and seek to hedge is not
capable of generating more return: we resort to utility functions in
microeconomics to reinforce the degree of risk aversion.


