4.4.5 Pollution water bodies
Though the study area is not crossed by any major stream, the
topographic map exhibits multiple rivulets including some with uncertain
physical destination. They might have been relayed by mechanical pathways
built purposely in an urban drainage plan, or obstructed by unexpected
obstacles that make it difficult to determine their conduit. Regardless of the
situation at hand, it represents a serious source of pollution representing the
receptacle of all kinds of municipal waste, and as such poses serious concerns
for health.
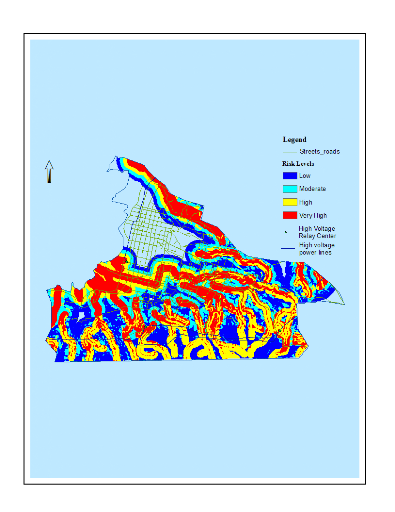
As reflected in the model, the total extent of pollution from
water was about 88% of which 56% was at high and very high risk, 18% moderate,
and 26% at low risk (Figure 16). The modeling of these areas integrated slope
to account for the accumulation factor across the path down to the sea and also
the likelihood of water pooling at low slopes atop of high slope. As can be
seen on the map less areas in high elevation were exposed to high risk.
However, neighborhoods in low elevations and even not near channels experience
high risks.
A large part of the downtown area was not part of this assessment
as shown on the light blue section in the northwest. This was because ponds
and water pooling in canals could not be precisely digitized. However this
area is known for poor drainage and channels obstruction by waste, which allow
very unclean water to flow on the streets.

Figure 16: Pollution from
Water bodies
Once again, rivulets that flow near the border of the study area
but that did not cross or intersected the area, were not included in the
determination of this hazard, though they might have had a partial impact.
4.4.6 Pollution from the coast
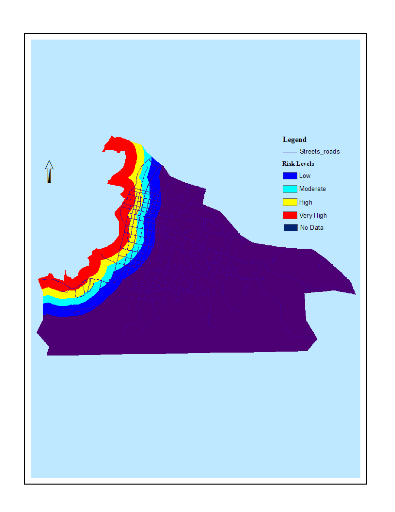
Pollution incoming from the sea encompasses about 23% of the
study area, among which more than half is at high and very high risk (Figure
17). This area is the densest in term of habitat and traffic, and hosts most
of the slums, commercial activities, some formal and informal market places.
In addition, it comprises the path of one branch of high voltage power line as
well as a power distribution center, and the cemetery and some of the hospitals
are also located close to this area. Consequently it is deemed as one of the
most unsafe neighborhood to live. Nevertheless, as noticed above, this is the
area with the densest population. Any sanitation, urban conversion program,
dislocation and relocation program, health intervention, should initiate in
this area located in the storm's eye in term of environmental health risks.

Figure 17: Pollution from
the sea coast
4.4.7 Pollution from high voltage electric power
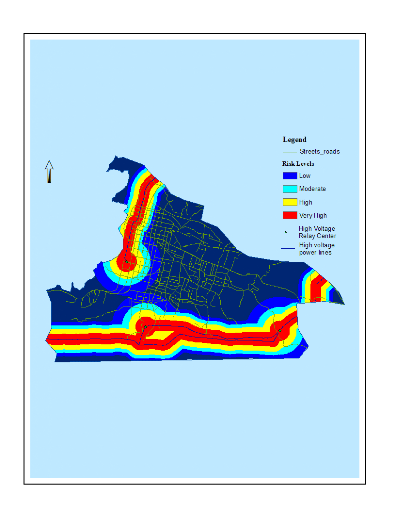
This hazard was mainly identified along transects in the south
and the northwest section and extended over more than half of the study area.
Neighborhoods under high and very high risks represented over 30% of the total
area. However, though the high and very high risk of the south section of this
hazard is very obvious on Figure 18, it did not appear on the result of EOW
combination. The EOW combination weakens its impact by the fact that part of
this area is isolated in high elevation and low housing density and poorly
influenced the combination. This underlines the importance of approaching the
analysis of the factors both globally and individually.

Figure 18: Pollution from
high voltage power
| 


