4.4.8 Pollution from the hospitals
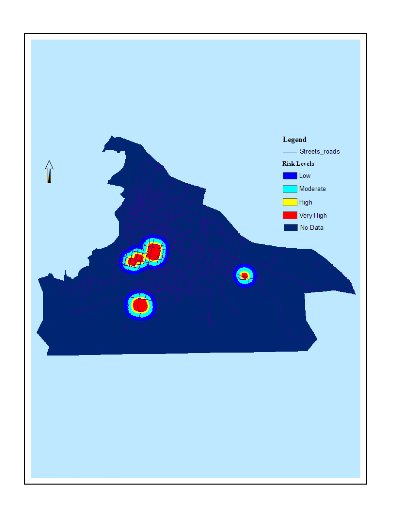
Buffers of different sizes were applied in relation to the size
and the level of care used at the hospitals. This information was gathered
from health professionals accustomed to these facilities. The hazards they
represent account for more than 7% of the study area, of which only 30% was
considered at high to very high risk (Figure 19). This low percentage was
expected because of the small buffer applied around three out of 5 hospitals.
Nonetheless the high rate of low and moderate risk levels does not mean absence
of risk, yet a direct measurement of pollution concentration within this
delineation is required.

Figure 19: Neighborhood
pollution from Hospitals
4.4.9 Pollution from the cemetery
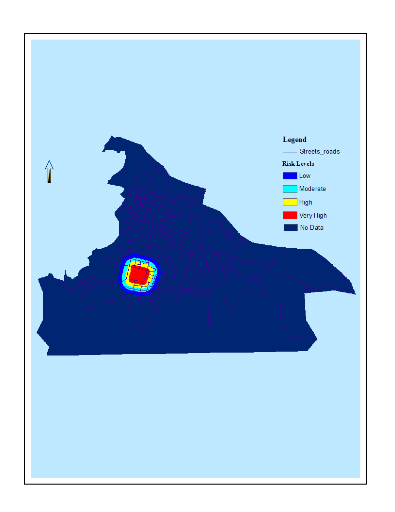
This hazard represents the smallest in terms of area extent: 4%
of the entire area. High and very high risks were identified in less than 2%
of the study area (Figure 20). However, as mentioned earlier, it is believed
that a reasonable extension of the buffer westward would result in a greater
physical incidence. We assumed that this part was partially covered in the
pollution from water bodies, traffic and waste pollution. An inspection of
these maps at the west side of the cemetery confirms this hypothesis.

Figure 20: Neighborhood
pollution from the central cemetery
| 


