IV.1) INCIDENCE
A total number of 14868 were admitted in the general pediatric
unit of the YGOPH within the studied period, among which 43 cases of bacterial
meningitis were admitted with biological evidence of either leucocytes count
>10 cells /mm3 or positive bacteria culture or soluble antigen, (from which
bacteria were isolated in 16 cases) giving an incidence of 0.3%.
IV.2) SOCIODEMOGRAPHIC CHARACTERISTICS OF PATIENTS
Age groups
14(32.6%)
16

14
12
10
4
8
6
0
2
13(30.2%)
8(18.6%)
2(4.7%)
6(14.0%)
[1-3mths[ [3mths-1yr [ [1yr-3yrs [ [3yrs-5yrs] >5yrs
Figure 6 : Distribution of patients according to age
groups
The age range of 3months - 1year had the highest percentage of
32.6 %, out of the total number of patients admitted for bacterial meningitis.
The mean age of patients admitted was 22.4 months (ranging from 1 - 60
months).
35
Table I: Distribution of patients according to
gender
Sex Number Percentage(%)
Male 19 44.2
Female 24 55.8
Total 43 100
The female sex is noted to have the highest admission with 24
patients among the 43 cases with a sex ratio of 0.8.
IV.2.3) Type of admissions
Type of admission
26(60.5%)
30
25
20
15
10
5
0

17(39.5%)
YGOPH Referral
Figure 7: Distribution of patients according to the type
of admission.
Most of the patients (60.5 %) consulted directly and 39. 5 %
were referred.
36
V.2.4) Distribution of patients according to year of
admission
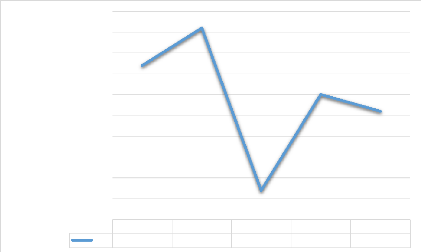
0.5 0.45 0.4 0.35 0.3 incidence per year 0.25 0.2 0.15 0.1 0.05
0 Year
0.46
0.37
0.3
0.26
|
0.07
|
|
2014
|
2015
|
2016
|
2017
|
2018
|
|
0.37
|
0.46
|
0.07
|
0.3
|
0.26
|
Figure 8: Flow chart illustrating the incidence per year
at YGOPH.
From the year 2014 there was an increase in incidence of 0.37
%, with a total number of 8 cases confirmed with meningitis, to 2015 with an
incidence of 0.46 % with a total number of 12 confirmed cases. Then came a
sudden drop of incidence in 2016 with 0.07% with a number of 2 cases, then
increased as from 2017 with 0.3% with a number of 11 cases and slightly dropped
in 2018 with 0.26 % with 10 confirmed cases.
37
IV.3) CLINICAL PRESENTATION OF BACTERIAL MENINGITIS Table
2: Distribution of clinical presentation according to symptoms.
Symptoms Number Percentage(%)

Neurologic
- Convulsion 26 60.5
- Cevical pain 2 4.7
Digestive
Respiratory
Behavioural
Thermal
Total 41 95.3
otl
Total 23 53.6
Total 8 18.6
Total 31 72.2
Total 10 23.3
- Loss of
consciousness
- Headache
- Diarrhea 10 23.3
- Feeding problems - Vomiting
- Irritability 10 23.3
- Respiratory distress 8 18.6
- Fever 41 95.3
2
7
6
1
4.7
2.3
16.3
14.0
Most patients presented with fever (95.3) % and convulsion
(60.5) % at admission.
38
Table 3: Distribution of neurological clinical
presentation according to signs
Clinical signs Number Percentage(%)
Neck stiffness 9 20.9
Meningeal signs 7 16.3
Bulging fontanella 4 9.3
*Among patients with meningeal signs 7 had both
Kernig and Brudzinski sign.
The clinical sign most found was neck stiffness with 20.9 % of
the total patients admitted, followed by meningeal signs at 16.3 % where both
Kernig and Brudzinski's signs were present in all patients who presented with
meningeal signs that is 100 %.
39
| 

