3.2. The functioning of the transport system
A collective transport system includes three components:
vehicles, infrastructures, and techniques of exploitations. Each one of its
elements influencing as well on the capacity of this transport system as on its
rate per hour which is the number of passengersto transport per hour and
direction.
Indeed, the road infrastructure being the support of any road
terrestrial displacement, it is possible to optimize and make profitable the
functioning of the transport system by improving its characteristics.
In the town of Yaoundé, the average width of the
streets (between frontages) is around 20 Meters the roads have an influence
going from 6 meters to more than 60 meters (Boulevard of May 20th) of width
between frontages. The Table hereafter which gives the distribution of the
roads raised according to the number of lanes by directionwatches that only a
third of the raised ways thus has 2 to 3 lanes by direction.
Table7: Numbers of ways by direction in the streets of
the town of Yaoundé
|
Types
|
Kilometers
|
Percentages (%)
|
|
1 way
|
108
|
67%
|
|
2 and 3 ways
|
42
|
26%
|
|
Separateways
|
12
|
7%
|
|
Total
|
162
|
100%
|
|
Total
|
162
|
100%
|
Source : PDU
In fact, this narrowness of
streets observed in the town of Yaoundé can be conceded with the
insufficiency of the secondary roadway system; This level of roadway system is
essential because it relates to ways which strongly structure the internal
exchanges with the perimeter of study (urban space in this case) but also with
outside. Today, it is this level of roadway system which is the least readable
in the town of Yaoundé. It (secondary roadway system) does not provide
correctly its functions in particular for the soft modes and public
transport.
The objectives of installation of this type of infrastructure
must be:
· To define characteristics which make it possible to
ensure the fluidity and the safety of all the modes of displacements;
· To allow public transport to be powerful and to provide
to the cyclists continuous cycle installations.
A hierarchisation of the principal traffic motivations carried
out in the town of Yaoundé gives the percentages gathered in the
following table
Table8: Distribution of the
principal traffic motivations in the town of Yaoundé
|
Reasons
|
Numbers
|
Percentages (%)
|
|
Residence - work
|
3654
|
20%
|
|
Work - residence
|
2068
|
12%
|
|
Residences - Visits
|
1437
|
8%
|
|
Work - Work
|
1270
|
7%
|
|
Residences - Stores (Markets)
|
886
|
5%
|
|
Visits - residences
|
754
|
4%
|
|
Residences - businesses
|
731
|
4%
|
|
Stores (Markets) - Residences
|
721
|
4%
|
|
Residence - School
|
692
|
4%
|
|
School - Residence
|
562
|
3%
|
|
Total
|
12775
|
71%
|
|
Total investigations
|
17955
|
|
Source : PDU
These reasons account for 71% of all the
traffic motivations raised at the time of the investigations. The reasons
related on the residence and works are most important, those related to the
visits, stores and schools follow them of rather far. These data must thus be
taken into account in the installation of a powerful roadway network system
especially with regard to urban displacements.
2.183.000 vehicleswere counted during the
investigations of traffic, that is to say an average of 13.400
vehicles per section of roadway system on which a station of
investigation was located. The traffic ranges between 1.500 to
33.400 vehicles by direction on the whole of the surveyed
sections. The morning traffic is roughly distributed 60-40
between the two directions, with a maximum traffic of 800
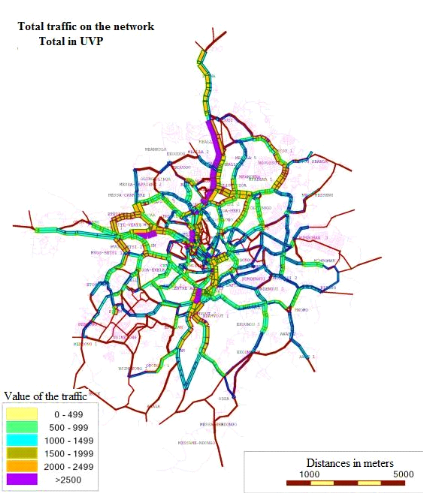
vehicles per hour for the most charged direction. Within the city, the
traffic of the vehicles is highest on the network in the north of the
roundabout of Nlongkak and at the level of the crossroads of Warda and the Post
office. The traffic generally has a radial structure in the town of
Yaoundé. It moves mainly towards the center town area, the commercial
districts and the administrative buildings. The motor bikes meet especially in
periphery of the city. The decree prohibiting the motor bikes taxis in the
center of Yaoundé thus seems respected. We observe in particular many
displacements in the motor bike in the western part of the city.

Figure 7: Total traffic on
the roadway network system structuring town of Yaoundé
Source: PDU
The average rate of congestion on the network at the rush hour is
of 0,3; knowing that a rate of congestion higher than
1 would mean a saturation of the network. The saturated sections
represent 14 kilometers out of the 270
kilometers of the structuring network, that is to say
5% of the linear total.
The proportion of the taxis and the cars in the total traffic
is exceptionally high in Yaoundé; Together they account for
91% of the counted traffic. The proportion of the taxis on the
sections where counting took place varies from 19% to
72% of the total traffic of the vehicles with an average of
52%. It is a very high figure which proves the insufficiency
of the services of public transport per bus and minibus.
With regard to the vehicles used in the installation of a
powerful transport system, it would be preferable to have large vehicles which
have important capacities such a bus which has a capacity from 60 to
100 places or 270 places for the Bi-articulated
buses, against 10 to 20 for the minibuses, 05
for the taxis and finally of 01 place for the motor bikes.
These different modes, it is clear, compared to the bus have a
highercoefficient occupation time of space per passengers.
From which does it thus come that these various other
means of transport (minibus, taxis and motor bikes) make remarkable great
strides in the various Cameroonian cities in general and in the town of
Yaoundé in particular?
Their rise can be to regard as letting show through a failure,
a weakness of the various transport systems undertaken by the public
authorities through the country.
The fact of being owner has importance for the people using
their car and their motor bike. Nearly a quarter of the questioned population
stated not to have the choice between various means of transport, for various
reasons such as:
· Not-adequacy of the transport infrastructures,
· Absence of freightvehicles
· Insufficient income to take another means of
transport.
20% of the people investigated declare that
they choose the fastest means of the transport; it is particularly true for the
motor bikes on the short distances. 13% choose the mode the
least expensive, primarily the buses, and 9% seek best comfort
in the mode than they chose. The average time of displacements all modes raised
by the investigations is 29 minutes. On the other hand the
users of the buses have on average 50 minutes of voyage,
including waiting, which is clearly a brake to the use of the transport system
by bus.
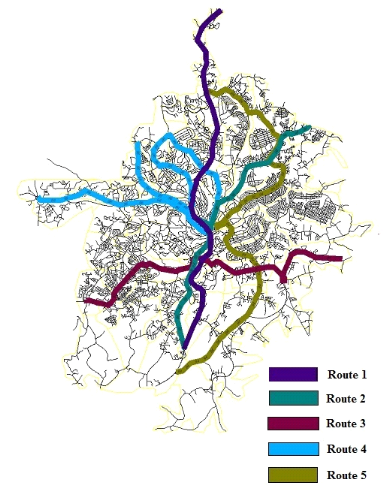
A study of speeds of course by motor bikes and by cars on
05 routes in the town of Yaoundé emphasizes an average
rate of travel in the car of 16,5 km/h. The mean
velocity of the cars is lower by 3 km/h than that of the motor bikes, because
these last circulate more easily than the cars in the zones of strong
traffic.

Figure 8: Routes on which
run times were measured
Source: PDU
Table9: Listing of the routes
|
Route
|
Origin/Destination
|
Distances in km (02 cumulated directions)
|
|
1
|
Messassi gendarmerie/OnambeleCrossroads
|
40,8
|
|
2
|
Crossroads Onambele Barrier/Crossroads Entered College of
Ngoulemakong
|
35,0
|
|
3
|
Bitotol (Crossroads Horeb College) /Mendong Village
|
32,8
|
|
4
|
Crossroads Nkolbison/Febe Village
|
49,3
|
|
5
|
Crossroads of the Palace of the Unity/Crossroads Tradex
service station
|
43,1
|
Source : PDU
Tableau 10: Results of the investigation of running
times (in minutes) (Cars)
|
Direction 1
|
Direction 2
|
Total
|
|
Length
|
Time
|
Speeds
|
Length
|
Time
|
Speeds
|
Length
|
Time
|
Speeds
|
|
1
|
20,6
|
88,0
|
14,0
|
21,1
|
78,0
|
16,2
|
41,7
|
166,0
|
15,1
|
|
2
|
18,2
|
57,0
|
19,2
|
18,1
|
49,0
|
22,2
|
36,3
|
106,0
|
20,5
|
|
3
|
16,8
|
59,0
|
17,1
|
16,8
|
67,0
|
15,0
|
33,6
|
126,0
|
16,0
|
|
4
|
26,0
|
108,0
|
14,4
|
25,9
|
106,0
|
14,7
|
51,9
|
214,0
|
14,6
|
|
5
|
22,5
|
80,0
|
16,9
|
22,3
|
85,0
|
15,7
|
44,8
|
165,0
|
16,3
|
|
Moy
|
20,8
|
78,4
|
16,3
|
20,8
|
77,0
|
16,8
|
41,7
|
155,4
|
16,5
|
Tableau 11: Results of the investigation of running
times (in minutes) (Motor bikes)
|
Direction 1
|
Direction 2
|
Total
|
|
Length
|
Time
|
Speeds
|
Length
|
Time
|
Speeds
|
Length
|
Time
|
Speeds
|
|
1
|
20,6
|
56,0
|
22,1
|
21,1
|
53,0
|
23,9
|
41,7
|
109,0
|
23,0
|
|
2
|
18,2
|
60,0
|
18,2
|
18,1
|
52,0
|
20,9
|
36,3
|
112,0
|
19,4
|
|
3
|
16,8
|
57,0
|
17,7
|
16,8
|
57,0
|
17,7
|
33,6
|
114,0
|
17,7
|
|
4
|
26,0
|
78,0
|
20,0
|
25,9
|
80,0
|
19,4
|
51,9
|
158,0
|
19,7
|
|
5
|
22,5
|
72,0
|
18,8
|
22,3
|
87,0
|
15,4
|
44,8
|
159,0
|
16,9
|
|
Moy
|
20,8
|
64,6
|
19,3
|
20,8
|
65,8
|
19,5
|
41,7
|
130,4
|
19,3
|
Source : PDU
Studies made it possible to model the relationship between the
flow and the speed of circulation on a way; they thus make it possible to
define and this with a function represented by an ellipse, this relation.
Flow
When we places in X-coordinate the flow «Q» and in
ordinate practicable speed «V», we notes that to a low flow
correspond two very different practicable speeds: one high and the other weak.
The corresponding concentration is then inversely proportional to the speed:
the higher speed is, the weaker the concentration is.
Speed
Figure 9: Theoretical
curve of the relation between the flow and speed on a way
The relation between the flow and the speed of circulation
establishes that in situation of «hyper congestion» in the lower part
of the curve, the increase in the traffic decreases the number of vehicles per
hour circulating on the way (numbers of passengers per hour, if we consider
only public transport). The important congestions that occur on the main axes
of connection centers/periphery in the agglomeration of Yaoundé let
think that we are in situation of hyper congestion at the rush hours. The
recourse by artisanal transport, majority in the traffic, to vehicles of low
capacity involves a loss of capacity of the access roads to the center thing
which tends to worsen with the narrowness of the streets observed in the town
of Yaoundé.
The resolution of these multiple problems with which is
confronted the operation of the transport system in the Cameroonian cities in
general and the town of Yaoundé in particular thus passes inevitably by
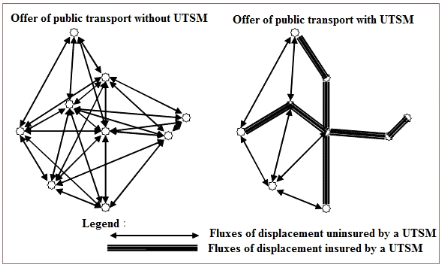
solutions such the urban installation of a urban transport system of mass which
will make it possible to reduce the number of vehicles on the ways and thus to
reduce the levels of congestion on the various ways components the roadway
network system.

Figure 10: Reorganization
of the offer of public transport with anUrban Transport System of
Mass
It is important to point out the fitting of adequate
installations which will have to allow the good installation and the good
performance of this urban system transport of mass. We can list
· The increase in linear of the secondary network roadway
system,
· The maintenance of this network
· The installation of certain facility for the joint grid
system such the exclusive way which is a way reserved exclusively or not for
the circulation of the bus or any other particular transport system such the
tram. The installation of this type of way makes it possible to separate the
bus for example from the current traffic what contributes to improve its speed
and thus its profitability like transport system.
Indeed, Because of weakness of the level of coverture of the
urban highway network (paved and in good state) in the Cameroonian cities, to
integrate these installation on all the access roads would be utopian and
unsuited. In order to be realistic, we recommend an integration of this type of
installation on the major axes of the agglomerations. For example, with the
configuration of the roadway network structuring the town of Yaoundé as
higher presented, it more suitable to integrate this installation (exclusive
way for Autobus) on the secondary routes of the city. Thus, this modification
of the profile across the primary and secondary roadway system would make it
possible the transport system by bus to be better integrated in the city
because it would serve the various major axes effectively leading to the
various districts of the city and thus would leave the relay to the other modes
such the taxi and/or the motor bike the care to continue the service road in
the depths. That would make the transport systemby Autobus more effective
because it would combine this time speed, comfort and safety.
|
|


