Annexes B : Estimation du modèle
spécifié
Tableau n°12 : Estimation du modèle de
long terme
|
Dependent Variable: LPIBR
|
|
|
|
Method: Least Squares
|
|
|
|
Date: 05/11/21 Time: 21:21
|
|
|
|
Sample: 1990Q1 2019Q4
|
|
|
|
Included observations: 120
|
|
|
|
|
|
|
|
|
|
|
|
|
|
Variable
|
Coefficient
|
Std. Error
|
t-Statistic
|
Prob.
|
|
|
|
|
|
|
|
|
|
|
|
C
|
29.26741
|
2.434853
|
12.02019
|
0.0000
|
|
LCREDB
|
-0.007962
|
0.121226
|
-0.065682
|
0.9477
|
|
LTDIR
|
0.349928
|
0.170758
|
2.049261
|
0.0427
|
|
LTINFL
|
-0.064758
|
0.090008
|
-0.719472
|
0.4733
|
|
EXPORTNET
|
3.05E-06
|
2.41E-07
|
12.63630
|
0.0000
|
|
LTCHOM
|
-1.949013
|
0.496361
|
-3.926607
|
0.0001
|
|
|
|
|
|
|
|
|
|
|
|
R-squared
|
0.848452
|
Meandependent var
|
20.03133
|
|
Adjusted R-squared
|
0.841805
|
S.D. dependent var
|
2.820315
|
|
S.E. of regression
|
1.121744
|
Akaike info criterion
|
3.116353
|
|
Sumsquaredresid
|
143.4473
|
Schwarz criterion
|
3.255728
|
|
Log likelihood
|
-180.9812
|
Hannan-Quinn criter.
|
3.172954
|
|
F-statistic
|
127.6474
|
Durbin-Watson stat
|
0.346739
|
|
Prob(F-statistic)
|
0.000000
|
|
|
|
|
|
|
|
|
|
|
|
|
|
Tableau n°12 : Estimation du modèle de
court terme
|
Dependent Variable: D(LPIBR)
|
|
|
|
Method: Least Squares
|
|
|
|
Date: 05/11/21 Time: 21:37
|
|
|
|
Sample (adjusted): 1990M02 2019M12
|
|
|
Included observations: 359 afteradjustments
|
|
|
HAC standard errors & covariance (Bartlett kernel, Newey-West
fixed
|
|
bandwidth =
6.0000)
|
|
|
|
|
|
|
|
|
|
|
|
|
|
Variable
|
Coefficient
|
Std. Error
|
t-Statistic
|
Prob.
|
|
|
|
|
|
|
|
|
|
|
|
C
|
-0.013670
|
0.018240
|
-0.749453
|
0.4541
|
|
D(LCREDB)
|
-0.116672
|
0.184634
|
-0.631911
|
0.5279
|
|
D(LTDIR)
|
0.291131
|
0.274652
|
1.060000
|
0.2899
|
|
D(LTINFL)
|
0.021062
|
0.068286
|
0.308431
|
0.0079
|
|
D(LTCHOM)
|
-0.651303
|
0.660129
|
-0.986631
|
0.3245
|
|
RESIDU(-1)
|
-0.215375
|
0.014053
|
-15.32591
|
0.0047
|
|
|
|
|
|
|
|
|
|
|
|
R-squared
|
0.819785
|
Meandependent var
|
-0.015037
|
|
Adjusted R-squared
|
0.806468
|
S.D. dependent var
|
0.381610
|
|
S.E. of regression
|
0.372639
|
Akaike info criterion
|
0.880156
|
|
Sumsquaredresid
|
49.01740
|
Schwarz criterion
|
0.945058
|
|
Log likelihood
|
-151.9880
|
Hannan-Quinn criter.
|
0.905965
|
|
F-statistic
|
4.489228
|
Durbin-Watson stat
|
1.994010
|
|
Prob(F-statistic)
|
0.000558
|
Wald F-statistic
|
0.313486
|
|
Prob(Wald F-statistic)
|
0.904783
|
|
|
|
|
|
|
|
|
|
|
|
|
|
Annexes C : Validation du modèle
1. Test d'autocorrélation des erreurs
Tableau n°13: Breusch-Godfrey Serial Correlation LM
test.
|
|
|
|
|
|
|
|
|
|
|
|
|
F-statistic
|
0.003125
|
Prob. F(2,351)
|
0.9969
|
|
Obs*R-squared
|
0.006392
|
Prob. Chi-Square(2)
|
0.9968
|
|
|
|
|
|
|
|
|
|
|
|
|
|
|
|
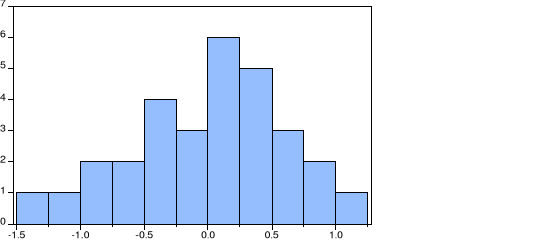
Graphique 1 : Test de normalité de Jarque-Bera des
résidus

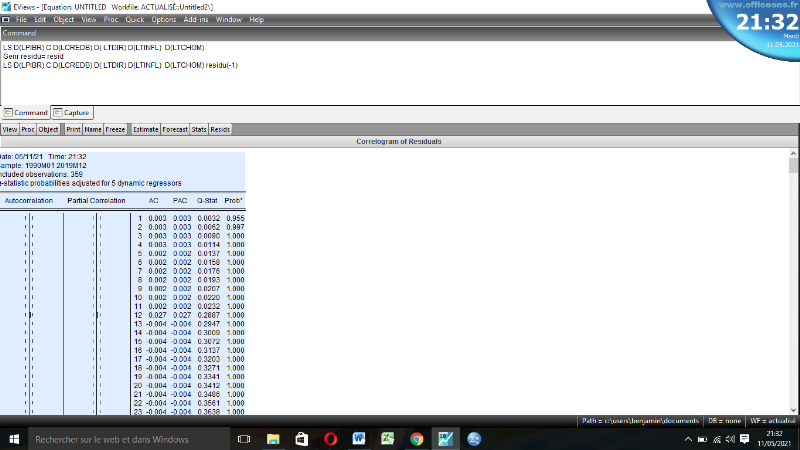
Tableau 2 : Corrélogramme des résidus
après estimation du modèle

2. Hétéroscédasticité des
erreurs
Tableau 15 : Test d'ARCH
|
|
|
|
|
|
|
|
|
|
|
F-statistic
|
0.003828
|
Prob. F(1,356)
|
0.9507
|
|
Obs*R-squared
|
0.003849
|
Prob. Chi-Square(1)
|
0.9505
|
|
|
|
|
|
|
|
|
|
|
|
|
|
|
|
3. Tests de stabilité du modèle
spécifié
Tableau 16 : Test RESET de Ramsey de spécification
du modèle
|
Ramsey RESET Test
|
|
|
|
Equation: UNTITLED
|
|
|
|
Specification: D(LPIBR) C D(LCREDB) D( LTDIR) D(LTINFL)
D(LTCHOM)
|
|
RESIDU(-1)
|
|
|
|
Omitted Variables: Squares of fitted values
|
|
|
|
|
|
|
|
|
|
|
|
|
Value
|
Df
|
Probability
|
|
|
t-statistic
|
0.019498
|
352
|
0.9845
|
|
|
F-statistic
|
0.000380
|
(1, 352)
|
0.9845
|
|
|
Likelihood ratio
|
0.000388
|
1
|
0.9843
|
|
|
|
|
|
|
|
|
|
|
|
|
|
|
|
|
|
|
|
|
|
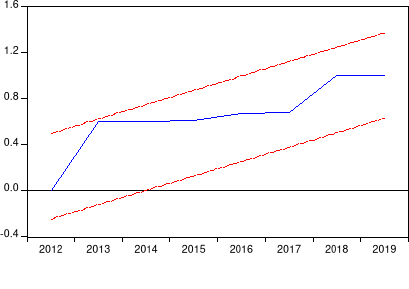
Graphique n°2: Test CUSUM des carrés
stabilité du modèle

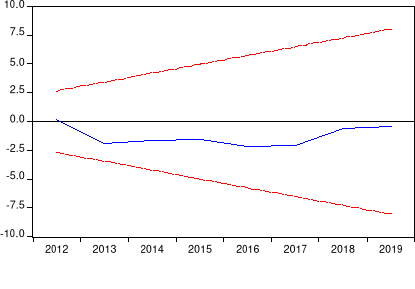
Graphique n°3: Test CUSUM de stabilité du
modèle


| 


