The role of financial institutions in value chain finance in the global southpar Mohamed Ali Trabelsi Technical University of Munich - Master of science Agricultural Management 2021 |

3. Methodology and DataOur research aims to examine how FIs can offer finance to support the actors along the value chain utilizing an AVCF approach. To our knowledge, no previous research has investigated how FIs use AVCF to support their clients. 3.1. Description of the study The study presented in this master's thesis is based on data collected by the author between July and September 2021 from financial institutions' websites in several developing countries in Africa, Asia, Oceania, and South America. It aims to highlight the extent to which the financial institutions can attract smallholders' farmers and agribusiness to benefit from the study presented in this master's thesis heir services. In total, 106 countries are included in this database [Annex B]. Among them are 98 developing countries and 8 developed countries, respectively Belgium, France, Germany, Italy, Luxembourg, the Netherlands, the UK, the USA.
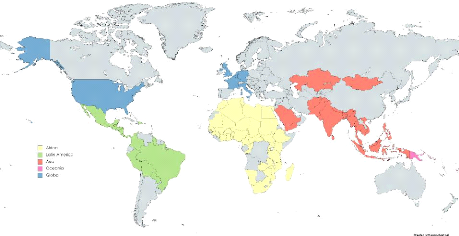
Figure 6: Geographical location of the financial institutions This database contains not only general information about the FIs, but also specific information detailed in the following section. This database will be used in the future to conduct a survey to enquire about the application of AVCF by FIs in several languages for the convenience of the participants.
23 3.2. Building the database Increasing numbers of FIs in the global south are involved in the agricultural sector and report their progress in recent years (Gonzalez & Rosenberg, 2006). The following database encompasses initially agricultural Banks. Afterward, it has been extended to reach Commercial Banks, state development banks, non-bank financial institutions (NBFIs), leasing companies, microfinance institutions (MFIs), credit unions, insurance companies, NGOs, international financial institutions, credit unions, and agricultural cooperatives. The purpose of investigating different FIs with different branches is to enquire if they apply agriculture value chain finance. The research purpose consists in reaching the maximum number of FIs in the Global South and collecting the maximum amount of information about these FIs to facilitate sampling later. Qualitative methods were employed to identify FIs, their type, foundation year, number of branches, and if available agricultural credit, gender programs, and digital solutions. I used several strategies to create the database starting with the common databases available, websites, and especially the FIs cited in the bibliographic studies. The database sources are:
6 Source: AFD, 2021 Accessed: 20 July 2021 See https://financeincommon.org/pdb-database
The following table shows the sources of FIs for the composition of the database: Table 5: Composition of database
I II III & IV
24 After eliminating double counting, these sources have been consolidated into a single database that includes about 347 FIs. The database covers the country of origin of every FI, acronym, foundation year, the number of branches, name of CEO if available, E-mail, and website. These contacts were determined with the aim to survey the role of financial institutions in Value Chain Finance in the Global South. In addition to the FIs, the database covers development funds, NGOs, and international financial institutions such as IFC and IFAD which finances agriculture and supports the value chain approach in many countries. There are thousands of other financial institutions that have been financing the agricultural sector for hundreds of years without being considered participatory in the AVCF (Zander R. , 2016). Furthermore, the database captures only a small fraction of funding bodies and relatively little information about the participating institutions.
25 3.3. Statistical Analyses 3.3.1. Qualitative Analyses: The term qualitative data refers to any data which is not numerical. Our case involves geographical variables, the types of institutions, the availability of agriculture loans, gender, and digital solutions. Depending on our objectives and research questions, we will focus only on thematic analysis from the six most popular qualitative methods listed below. Table 6: Most popular Qualitative Analysis method Qualitative Analysis Method 1 Content Analysis 2 Narrative Analysis 3 Discourse Analysis 4 Thematic Analysis 5 Grounded Theory 6 IPA: Interpretative Phenomenological Analysis Thematic Analysis: This method focuses on themes and patterns and examines meanings in a dataset. Essentially, this kind of analysis draws similarities from a large body of data that is often quite large and arranges them into themes. By focusing on specific themes, the study makes sense and has more meaning. It also allows us to compare several sets of variables. In this case, it would be feasible to review a few hundred FIs' websites to identify which one deals in agricultural credit. This would be an opportunity to find out also about the offers, services, and orientation of FIs. 3.3.2. Quantitative Analyses In quantitative analyses, we analyze data that is numerically based, or data that can be translated literally into numbers without losing the context, such as the gender in our case. This method is employed in the current thesis for three purposes; namely, to measure differences between groups, to analyze relationships between variables, and to test hypothesis. These tasks will require a combination of descriptive statistics and inferential statistics. The differences between the two are that descriptive statistics focus on describing the contents of the sample, while inferential statistics seek to make predictions about the population. The population in this context refers to the full set of financial institutions that we are interested in researching. However, we can only have access to a subset of these institutions. The reduced sample size is explained in detail in Section 3.5.2 of the report. In order to answer our
26 research question, we will use both types of quantitative analysis. The following table explores both types of statistics. Table 7: Quantitative statistic types descriptive statistics inferential statistics
There are many advantages to using descriptive statistics. Among them are that they provide a macro and micro picture of data, facilitate spotting errors and anomalies, and suggest which inferential statistics to use. In the other hand, inferential statistics determine predictions between two or more groups and most important relationships between two or more variables. 3.3.3. Cluster Analysis Using Excel functions will enable us to do descriptive and inferential statistics, but we will need to use the software RStudio to run cluster analysis and process complex functions. A cluster analysis or clustering is a data mining process in which a set of observations is grouped so that elements belonging to the same group are more similar than those in other groups. These groups are known as clusters (Vandeginste, et al., 1998). These are the two methods used to analyze clusters: K-means Clustering and Hierarchical Clustering. Here's how both methods work:
3.3.4. Data Types and Variables Along with the bank's name, the continent, and the acronym, there are ten additional variables highlighted in the search. Of them, seven are completely accessible on the official websites of the financial institutions, and three are partially accessible. The table below shows the variables and the method for finding them. Table 8: Data types Variables Search Method Name/ Scale Continent Institutional Type Foundation year Number of Branches Agricultural Loans Gender Digital solutions Total assets Total Equity Gross Loan Portfolio checking the institute's website C 0-3 checking the rubric «about us» T 0-11 checking the rubric «our history» F Year checking the rubric «locate us» B Number Checking the rubric «Products and Services» AL1, AL2 0-1 Checking the rubric «our value» and «events» G1, G2, G3 0-1 Verifying if «online banking» or other e-products DS1, DS2, 0-1 available DS3 investigating the most recent «annual report» AS $ investigating the most recent «annual report» EQ $ investigating the most recent «annual report» LP $ To capture the variety of information, several attributes (dummy variables) and sub-variables have been assigned to the seven previous variables according to the following tables. Table 9: Continent Attributes Continent Attribute
Each continent (C) has been assigned a unique attribute between 0 and 3 as show in the previous table. Table 10: Institutional Type Attributes Institutional type Attribute 0 1 2 3 4 5 6
27 Agricultural Bank Commercial Bank cooperative Credit union Development Bank Insurance company International FI International Fund Islamic Bank MFI NGO 7 8 9 10 state development bank 11 Each Institutional type (T) has been assigned a unique attribute between 0 and 11 as show in the previous table. Regarding Foundation year (F) Number of Branches (B), As the data are numerical, they will be analyzed directly. Table 11: Agricultural loans Attributes Agricultural loans Attribute
Farmer credit, AL1: The financial institutions included in this database provide a range of financial products, such as consumer credit, advances, salary advances, mortgages, car loans, or asset acquisitions as well as cashback loans. Apart from these loans, some FIs offer specific services and products to farmers, including Farm input loans to meet the need for financing inputs (such as seeds and chemicals), machinery, labor, and harvesting. Further, agricultural credit tailored to meet any economic need of the farmer, such as the purchase of merchandise or other income, with flexible amounts and long-term terms and fast processing is offered. During data processing, we will assign "1" to AL1 where institutions offer agricultural credit to small-scale farmers, and "0" to AL1 when no such credit is offered, or the offer is restricted to the above-mentioned non-agricultural credit. Agribusiness Credit, AL2: This is a loan designed to help support the value chain players in the agricultural inputs and equipment manufacturing, stocking, importing, exporting, trading, and storing sectors. The credit facility is intended to facilitate agri-business enterprises and finance working capital and operational needs across the value chain. Beneficiaries may include agri-dealers, agro-processors, input manufacturers, and agro-importers and exporters. If there is an agribusiness credit, a "1" will be assigned and if there is none, a "0" Table 12: Gender Attributes Gender Attribute
28 Credit facility for women
Credit facility for women, G1: Many financial institutions have developed direct lending programs targeting women in the agricultural value chain. The objective is to finance women-led small and medium enterprises, strengthen their inclusion in agriculture, and encourage them to engage in commercial activities. In this case, a «1» will be assigned to G1, and «0» otherwise. Career development, G2: Some financial institutions promote gender equality at work, which means that women can enjoy the same rewards, opportunities, and resources as men at a company, which include equal pay and benefits for comparable jobs with comparable responsibilities, equal opportunities for promotions and career progression, and equal consideration of needs. G2 will be assigned "1" in this instance and «0» otherwise. Gender Programmes G3: Other banks offer gender programs and celebrate events such as International Women's Day, sign agreements with associations protecting women's rights by offering specific services. In addition, they allow women to participate in a draw to win a savings account or a scholarship dedicated to the education program abroad. Other initiatives are available for women who excel in their studies to participate in workshops with senior executives and receive answers to their bugging questions. This aim is to empower youth females in taking a strong stance on their future. G3 will be assigned «1» in this case and «0» otherwise. Table 13: Digital Solutions Attributes Digital solution Attribute Online Banking E-Products: DS1 DS2
Online Banking DS1: Some financial institutions offer a secure online banking platform that could be used to access banking services efficiently. The portal offers clients the ability to review account balances, obtain statements, send money, pay bills, and review transaction history. DS1 would receive a "1" if this were available; otherwise, it would receive a "0".
29 E-Products: A variety of products are available to clients to keep them informed and simplify banking. Email banking, in which the account history over a specific period is sent. Mobile banking features include SMS alerts for withdrawals and deposits, as well as debit card transactions, funds transfers, and other transactions. Users can also access and manage their savings accounts and transfer money from their account to a beneficiary or anyone else using mobile banking. A "1" will be assigned to DS2 if one of these facilities is available, and an "0" if not.
30
31 Online Loan application: In several financial institutions, clients can apply for a personal loan online, securely, and easily. The process is fast and secure. Once the loan is submitted, the details of the facility fees and due date will be displayed, and SMS confirmation will be sent. DS3 will be assigned "1» in this case Concerning international financial institutions, the number of agencies is being replaced by the number of countries in which it operates or the number of foreign offices. For Gender and Digital Solutions, it was checked whether the project focuses on women or presents a digital footprint of its approach. Lastly, the total assets and capital are substituted by the total amount granted by the institution for the project. Concerning the last three variables (Total assets, Total Equity, Gross Loan Portfolio) and due to the lack of these information in several financial institutions, we will not consider them during the analysis. 3.3.5. Other components of the database Additional data in the database include the institute's website, its general email address, the name of a CEO/manager who works in the institute, and if available, his personal contact information. The last cases are attributed to mentions of the institute in the literature and contact information of the author. 3.4. Structure of survey Quantitative methods were used in a survey in order to measure the role of FIs in facilitating the AVCF in the Global South (GS). The purpose is to determine the financial products, credit screening and scoring for agriculture loans, mechanisms, and Instrument used by FIs in the aim of reducing TC, managing risks, and assisting small-scale farmers to access financing. Online Survey: conducted in the Global South (GS) with FIs which apply and do not apply the AVCF. To define the survey questions, an extensive and careful review of the scientific literature will be carried out to check standard questions that have been used and employed by major survey, then develop the most appropriate questions. The period of the survey was in July-September 2021. The survey contains 5 sections:
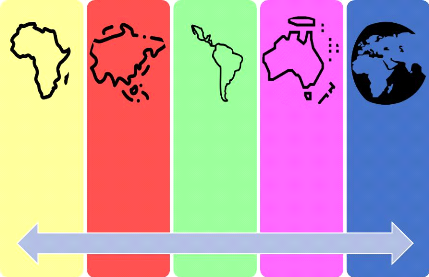
A standardized survey was designed using the platform Qualtrics used to create this survey, number questions, generating test responses and reviewing survey accessibility. Therefore, to facilitate data processing and for a quick tabulation of results, only multiple-choice questions will be used, and before starting the survey, a pretest of the survey and the pre-coding of these closed ended questions will be carried out. Finally, the data collected was analyzed using Microsoft Excel and R for result generation. This resultant analysis of the data will make it possible to draw conclusions about the effectiveness of the use of the Agricultural Value Chain Finance (AVCF) by financial institutions (FIs). This assessment provides evidence to decision-makers, development agencies, and all types of rural FIs and shows priority areas that require intervention regarding the accreditation of credit for small-scale farmers. 3.5. Sample Design 3.5.1. Sampling frame This database includes several independent financial institutions from different provenances in the Global South with a total sample size of 347 institutions. It was designed to produce reliable estimation at the international level. Accordingly, the universe for the database includes FIs mentioned as per criteria identified in table 5; FIs from the platform Finance in Common, FIs from literature reviews on AVCF, FIs in other surveys and studies that do not include the AVCF methodology, and FIs from the internet search engines. According to Dados & Connell (2012), The term "Global South" commonly refers to regions in Latin America, Asia, Africa, and Oceania. It is part of a family of terms, including "Third World" and "Peripheral," that refer to regions outside of Europe and North America that are considered mostly low-income and often politically or culturally marginalized. The use of the term «Global South» reflects a shift from a central focus on development or cultural difference to a focus on geopolitical power relations. Our sampling frame for the database included countries around the globe with at least one FI that funds the agricultural sector in the Global South even if the FI is not a member of this zone. The next figure shows the classification of the chosen countries by continents. Database: 347 financial institutions across the 5 continents:
Africa Sample FIs: 200 Asia Sample FIs: 52 Latin Sample FIs: 63 Oceani a Sample FIs: 16 Global Sample FIs: 16
32 Figure 7: Geographical distribution of financial institutions 3.5.2. Sampling techniques The total sample size of 347 FIs was divided into two categories based on their source. The categories are FIs encountered while conducting the bibliographic study and FIs obtained from other sources (Google & Platform: Finance in Common). It was decided to eliminate the second group (FIs not cited in the literature) as a means of reducing the sample size and facilitating processing. As a result, the sample (202 FIs) will be considered for time considerations. The exemption will apply only to financial institutions that lack an official or functional website. Due to the different orientations and types of agricultural interventions of these FIs, the differences in information available, the difficulty of gathering the same information under the same categories chosen, and above all to give meaning to the descriptive analysis, the final data sample will be reduced by 57 FIs. In this case, the snowball effect will be used to construct this database. The database is then finalized by separating each FIs through the source, official website & Information available, and type of intervention in the agricultural sector. To account for the unavailability of the official website, missing information about the FIs, the target sample size was decreased to 144 FIs assuming a participation rate of 42%. FIs website were checked and validated before it was added to the database. Figure 8 shows the selected criteria and summarizes the stratification method. 1st Stratification (FIs Sources) FIs from the Bibliography Google & Finance in Common
2nd Stratification (FIs officials website) Global South regions Funding Agriculture
3rd Stratification (FIs intervention type) Local FIs International FIs
33 Figure 8: Listing criteria of financial institutions in the final database The full information about the database can be found in Annex B. 3.5.3. FIs Listing: A spreadsheet with FI's data was listed in an excel file as described int the previous section. There are six sheets in this Excel file. First, we provide a summary of the general classification of each FI, and we explain the different colors and abbreviations used. A further four Excel sheets bearing the names respectively Africa, Asia, America, and Oceania were then created, holding FIs from the search engines and from the finance in common platform. Finally, the sixth Excel file contains the final sample with all the information required for data processing.
34 4. Survey Design and Conceptual Framework 4.1. Exploring other surveys 4.1.1. Survey with FIs In the bibliographic reference, only an interview made by Röttger (2015) was conducted with FIs providing agricultural finance to smallholders' farmers in Uganda, Kenya, Benin, and Cameroon. The FIs involved are two commercial banks (CB), three microfinance Companies (MFCs) and three membership-based financial institutions (MBFI). This survey7 contained primarily general information about FIs such as the country of origin, year of establishment, total assets, Gross loan portfolio, deposits, number of clients and branches. Then, the author has determined the percentage of the agriculture, loan portfolio of the total loan portfolio for the interviewed FIs and classified their loan product as a short-term loan (=12 months) and medium-term loans (=12 months). Table 14: financial Institutions General Information
Through these previous studies, we can conclude that there is consistent evidence that FIs play not just an important role in financing the agricultural VCs but engage with chain actors to develop new financing models, mitigate risks more effectively, and lower transactions costs. Nonetheless, there is a lack of robust research on the paramount role of FIs in implementing approaches such as AVCF, and the mechanisms used by FIs concerning credit screening, scoring, rating tools, and portfolio monitoring practices, which should be improved, developed, and replicated. 4.1.2. Survey with farmers (World Bank & CGAP) The World bank8 in cooperation with the Consultative Group to Assist the Poorest (CGAP) conducted a nationally representative survey of smallholder farmers in Bangladesh, Ivory Coast, Mozambique, Nigeria, Tanzania, and Uganda. The survey investigated the farming and non-farming activities, financial practices, and interests, as well as challenges and aspirations of smallholder families at the national level in six countries. Besides, this survey in each country has a nationally representative sample of about 3,000 families who indicated that agriculture makes a significant contribution to their household's livelihoods, income, or consumption. In total, more than 300,000 data points on the financial lives of smallholder families were collected from household surveys (World Bank and CGAP, 2017). This Smallholder Families Data Hub provide data about the Poverty Status, Income Sources, Regular Expenses, Household Segmentation, Crops and Livestock, Saving for Agriculture, Agricultural Markets, Financial Inclusion, Financial Tools, and Trust in Financial Services Providers of small-scale farmers. This table summarizes the focal points of the above findings. This research provides more detail on these focal points and profiles of the four main segments 8 Source: CGAP Assessed: 31 July 2021 See https://www.cgap.org/small holders data portal/
36 of smallholder households in the six developing countries. These findings are designed to identify opportunities for FIs, government, and NGOs to better adapt the financial tools and meet the needs of smallholder families Table 16: focal points of the World Bank Survey
The goals of this Smallholder Survey are first, generation of a clear picture of the smallholder sector (household demographics, agricultural profile, poverty status, market access). Second, a segmentation of smallholder households in the six countries according to the most compelling variables (at least these focal points) that emerge. Third, a characterization of the demand for financial services in each segment, considering the needs, attitudes and perceptions of clients related to both agricultural and financial services. Fourth, an explanation of the financial needs of each segment and how they can be met, with both informal and formal service s, and where there may be promising opportunities to add value (Anderson, 2017).
37 4.1.3. Integrated Financing for Value Chains (WOCCU) The publication9 of the World Council of Credit Unions illustrates how credit unions can fill the agricultural lending hole and create market links. It explores how these unions can provide value chain finance to improve productivity, promote economic growth, and ensure food security among small farmers (WOCCU, 2009). Moreover, a large part of their success in value chain finance is due to their strong community ties, presence in rural areas, and experience lending to low-income individuals and small businesses. Additionally, they developed new risk management strategies for lending to these producers. At each stage of agricultural lending, these credit unions have developed 10 ways to manage risk. The steps involved are:
This publication argued that value chain finance methodology can be relatively inexpensive to implement and can be adapted to different contexts, products, and environments. However, the value chain must be managed by someone who can bring together, facilitating, and ensuring that business relations are maintained to result in an efficient value chain that meets all participants' needs. 4.1.4. Survey on national development bank (World Bank Group) The paper summarizes the main findings from the 2017 survey of the national Development Banks conducted worldwide. Sixty-four DBs were surveyed from around the world, mainly from middle-income countries. Among the conclusions in this report is that although DBs tend to be small in terms of assets, governments use them to provide financial services to sectors or regions that are not well served by private intermediaries. Additionally, development banks operate in multiple economic sectors, contribute to global development agendas, and support 9 Source : WOCCU (2009) assessed : 08/10/2021 https://www.woccu.org/documents/value chain techguide
38 the private sector within their jurisdictions. Several institutions that participated in this survey noted that they face various challenges, including enhancing their risk management capacity and adapting better monitoring and evaluation frameworks (WBG & WFDFI, 2018). There are 16 sections in this questionnaire with 138 questions. We see the use of a variety of question types including yes/no, multiple choice, and open-ended questions. These 16 divisions in this survey10 are as follows:
Source: World bank Group, 2018 4.2. Credit Scoring for Agricultural Loans For the stability and the profitability of FIs, loan contracts must perform well, and the screening of loan applications from agribusinesses should minimize credit risks and reduce TC. In this regard, a credit analysis must be done by FIs before making a decision on credit accreditation as part of the examination process. This credit analysis takes into consideration the assessment of the financial backgrounds and history of the applicant. Therefore, a good credit management assists FIs in loan pricing, determining the amount of credit, reducing the default risk, increasing debt repayment, and predicting the credit worthiness of borrowers (Limsombunchai, Gan, & Lee, 2005). Even more so, credit scoring not only assist FIs in loan approval, but also on loan monitoring and assessment of loan portfolio risks (Turvey & Brown, 1999). According to Plata and Nartea (1998), credit analysis is the first step in a loan request. This covers the determination of the candidate's strength, estimating the probability of failure and reducing to an acceptable level the risk of nonpayement. In this context, several authors found that this method based on the evaluation of a loan officer sound to be not efficient (Crook, 1996; Glassman & Wilkins, 1997). 10 WBG & WFDFI (2018) Assessed 09/10/2021
39 A study made by Limsombunchai et al. (2005) on the estimation of lending descision for agricultural loans has enumerated several factors used by FIs on credit scoring. These factors include borrowers' liquidity, profitability, solvency, and repayment capacity. These variables can be inferred directly from the applicant's financial status. In addition to that, moneylenders consider the farmer's personal attributes, entreprise type, region, and many other factors mentioned in Section 2.5 (Table 3). On top of that, the relationship between the bank (lender) and the borrower influence the availabilty and cost of the loan (Petersen & Rajan, 1994; Harhoff & Korting, 1998). Limsombunchai et al. (2005) have developped a logistic model for the credit scoring which is a function11 of the borrower characteristics, credit risk, proxies, relationship indicators and dummy variables. This variables excluded are the estimation of borrower's liquidity and repayment capacity. The credit scoring models is as follows: Lending decision = f (Borrower characteristics, Credit risk proxies, Relationship indicators, Dummy variables) The variables of the function are summarized in the following table as well as those excluded from the function. Table 17: Lending decision variables
According to the authors, these variables are going to be rated by (+) or (-) in order to determine the lending decision. For example assets, age, collateral, capital turnover ratio, and duration are positevely related to the chance of a good credit. However leverage ratio and borrwing from other are negatively related to the chance of a good credit (Limsombunchai, Gan, & Lee, 2005). On the basis of the case studies showing the practice of the AVCF approach in the following value chain; potato in Peru, milk and organic quinoa in Bolivia, cotton in Tanzania, sal leaf in India, rice in Rwanda, honey and tea in Kenya, soybean in Ethiopia, coffe in Nicaragua. The 11 Source: Limsombunchai, Gan, & Lee, 2005, p. 1199 Assessed : 22 July 2021 See https://thescipub.com/pdf/ajassp.2005.1198.1205.pdf
40
41 authors of KIT and IIRR (2010) have established the key factors to depict financial products summed up in the following table12. Table 18: Loan accreditation Characteristics
On this background of the last reference, we can determine the factors and variables for Credit screening, scoring and monitoring for Agricultural loans (Limsombunchai, Gan, & Lee, 2005; KIT and IIRR, 2010). This will be used in the following section to determine the questions for part D of the survey 4.3. Financial instruments employed by FIs There are several ways to categorize the terms and describe the different financial products and instruments, e.g., Wenner (2006) categorizes these terms by product financing, receivables financing, physical asset collateralization, risk mitigation and structured enhancements. However, Miller and Jones (2010) in their books: «Agricultural Value Chain Finance Tools and Lessons» have categorized these terms and conditions differently. They classified the 16 instruments by 5 financial products as shown in the following Table13. Table 19: AVCF Instrument
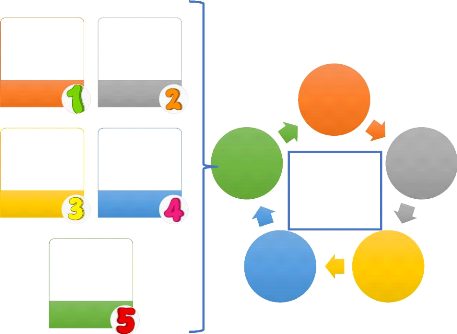
12 Source: KIT and IIRR, 2010 Assessed: 25 July 2021 See https://www.kit.nl/wp-content/uploads/2018/08/1610 chainfinance-d8.1.pdf 13 Source: Miller & Jones, 2010 Assessed: 22 July 2021 See http://www.fao.org/3/i0846e/i0846e.pdf The authors have mentioned that the use of these terms' changes according to the countries, moreover it can have other appellation and application of the instruments beside other legal terms. This table includes the traditional forms of credit and other more sophisticated and complex forms, and therefore some instruments may not be applicable to small-scale farmers, but on the other hand applicable for agro-industries and wholesalers. These sophisticated high-level instruments can in any case stabilize prices and reduce financing risk (Miller & Jones, 2010). 4.4. Survey design for FIs officials After reviewing the literature and exploring several references, considering the content of other surveys, and the revision of determinants of agriculture credit, credit scoring mechanisms and the different instruments presented early, we designed the online questionnaire for bank officials Annex C. This was based on the consideration of other surveys oriented for both farmers and FIs. To capture the complexity of the FIs survey, the online questionnaire consisted of five sections already announced in part 3.4 [structure of the survey]. For each FIs, an online questionnaire was administered to the CEO or head of office or director, to collect the information.
Section Section
Section
Section Section most Loans Data from the Major FIs way of business & Clients Figure 9: Financial institutions Questionnaire components
42 The FIs questionnaire collect first General & Economic Information, on whether each FIs contributes to VCF or participate to the AVCF. The information was later used to identify how FIs apply the approach AVCF in the Global South. Information on assets and Branches were also collected to derive the socioeconomic status of the FIs and the priority of financing the agricultural sector. In addition, credit accreditation criteria, financial products, and instrument employed were also enquired to find out how the FIs is funding rural producers. The below figure summarizes the sections of the survey. All 5 sections were translated in Arabic, French, and Spanish, then pretested in August 2021. After the pretest, debriefing Sessions were held with university staff and Experts to modify the online questionnaire based in the observations and the Feedback from the pretest. Next the questionnaires were finalized and a script in the platform Qualtrics were programmed to facilitate data collection. The script was tested and validated by the Supervisors. The following is in an explanation of theses 5 sections building on other studies. This methodology was designed to answer a few questions about the activities of FIs in the agricultural sector in the Global south. 4.4.1. General Information This part will be devoted to general information about the institute and the position of the respondents. This first section permits the understanding and the segmentation of FIs according to several key characteristics (e.g., demographics, institutional type, experience in the agricultural field) and what type of FIs emerge? What is the position of the person who responded to the survey? How many years has he or she worked in agricultural finance? This first part will allow the classification of FIs and then draw conclusions based on the latter segments. 4.4.2. Economic information This second section will collect economic information from FIs such as (Gross loan Portfolio, No of Branches, and No. of Clients) and will determine the importance of the agricultural sector among the other branches in terms of budget from capital granted for it and in terms of customers. Additionally, this part highlights the attitudes and perceptions of FIs. How they perceive their agricultural activities? What is the priority sector? What is the penetration rate? 4.4.3. Credit screening, scoring, and monitoring for Agricultural loans This part will determine the characteristics of credit accreditation and evaluate credit screening, scoring, and monitoring mechanisms for agriculture loans. This will allow us to have statistics on the different key characteristics on lending decision and to determine the differences in
43 consideration of this criteria between the different countries and continents. Which criteria does each segment of FIs demand, from the perspectives of both rural producers (age, education, marital status, agricultural experience, etc.) and financial products (e.g., amount, term, repayment schedule, collateral)? 4.4.4. Agricultural finance within value chains This section will investigate the FIs-official of the financial institute on the knowledge and application of the AVCF. This will help us determine the percentage of FIs that finance agriculture with this approach and understand the opportunities to improve the financial inclusion for small-scale farmers and agribusinesses in the one hand, and in the other hand mitigate risk and reduce transaction cost for the FIs. Where are the opportunities to add value with the approach AVCF? 4.4.5. Financial product & Instrument employed Based on the instruments determined by Miller and Jones (2010), this last section will investigate the respondents on the instruments used. What formal suite of financial mechanisms does each segment of FIs currently use? These 16 instruments were classified into 5 groups: Product financing, Receivable's financing, Physical asset collateralization, Risk mitigation products, and financial enhancement as shown in the figure below. Trader Input Marketing Lead firm Trade Factoring Forfaiting Warehouse receipts Repurchase agreements Financial Insurance Forward Futures Securitizatio n instruments Loan guarantees Joint
Product financing Receivables financing Physical asset collateralizatio n Risk mitigation products Financial Figure 10: List of instruments enquired during the survey 4.5. Overview of the online questionnaire During the bibliographic study, few research, discussion, and paper have identified a gap in the contribution of FIs in the agricultural credit (Meyer R. L., 2007; Yadav & Sharma, 2015),
44 evoked the needs, desires, and perceptions of FIs. This master's thesis involved defining the end objective by doing the following:
Using these building blocks, a framework for the online survey was developed to be shared with FIs and to capture all relevant elements of the AVCF. The framework thus comprised five main sections as previously announced is summarized by the following figure:
Economic Information General Information Agricultural finance within value chains Credit scoring meschanisms Instrument
Figure 11: Questionnaire Framework 5. Analysis and Results 5.1. Descriptive Analysis: 5.1.1. Geographic distribution: When examining the number of financial institutions, Africa dominates the database, accounting for 47% of all institutions. The Asian and South American FIs have a relatively low proportion of their cases studied in this database, at 24% and 20%, respectively. The rest of the database is composed of international financial institutions (IFI). The global scope of the IFIs enables them to operate in different developing countries and help promote agriculture development, sustainable resource management, and resilience. An overview of the database can be found in the following Table 20. Table 20: Classification of financial institutions by continent Continent Africa South America Asia Global Total
45 5.1.2. Distribution by institutional type: Based on the literature review on agricultural finance, our database suggests that they account for less than ten percent of total FIs. Most agricultural credit is provided by cooperatives, microfinance institutions, and partly by commercial banks (Table 20). Financial institutions in this database were classified according to the descriptions found on their own websites, predominantly in the rubric "about us" or "history". To gain an understanding of the most important FIs, commercial bank as described in the literature are financial institutions that accept deposits, provide services of checking accounts, offer various loans, and offer products like personal loans and business loans for both individuals and small businesses. However, cooperative are organizations where many small farms work together to produce and sell crops together. The cooperatives also provide the farmers with short-term agricultural loans which allow them to carry out many different agricultural and farming activities in the collective. In addition, a significant share of this database consists of MFI which is an alternative banking service that is available to unemployed or low-income individuals who would otherwise have no access to financial services, and development bank which provides capital to create productive investment opportunities, often in conjunction with technical assistance. Finally, Islamic bank is a financial or banking entity operating under shariah (Islamic law) and making
46 profits through equity participation, which entails the borrower giving the bank a share of their profits instead of paying interest. In light of the observations and case studies in this database, the cooperatives and MFIs do not deliver enough information to provide a meaningful sample or claim that agriculture financing is primarily provided by cooperatives. In some cases, cooperative groups are organized and monitored by non-governmental organizations, in others by international financial institutions and international funds, and in yet others, commercial banks lend to the cooperatives that then distribute the funds among the farms according to various financial institutions' websites which provide information on this. Additionally, there are cooperatives that collect farm savings and distribute them as needed in an organized and priority manner to their registered members. Cooperation has an important role to play in increasing agriculture credit availability, connecting commercial financial institutions, and ensuring small-scale farmers' financial inclusion. Table 21: Classification of financial institutions by institutional type Institutional type Number % Commercial Bank 48 33% Cooperative 47 33% MFI 21 15% Development Bank 9 6% Islamic Bank 5 3% International FI 3 2% International Fund 3 2% Agricultural Bank 2 1% Credit union 1 1% Insurance company 1 1% NGOs 2 1% State development bank 2 1% Total 144 5.1.3. Foundation Year: As shown in Table 22, according to this database, 42% of the financial institutions have been established since 1990. The rest of the FIs are over 50 years old. Furthermore, when examining the data, there are no conclusive evidence that financial institutions invest in agriculture after several years in the banking industry.
47 Table 22: classification of financial institutions by foundation year
5.1.4. Number of Branches Based on analysis of the number of branches per FIs, we find that 29% have less than 10 branches, 44% are in the interval [10-100], and 22% have between 100 and 1000 branches. Eventually, only eight FIs in this database have more than 1000 branches in the origin country. Table 23: Classification of financial institutions according to the number of branches
According to Table 23, more than half of the individuals in this simple with more than 1000 branches are from Asia. Several factors can explain this, including the high concentration of population in India. 5.1.5. Agricultural loans A total of 84 Farmer Loans (AL1) and 24 Agribusiness Credit (AL2) were found among the 144 FIs in this database. There are several important institutions contributing to this financial offer - mostly cooperatives. They hold the top position with 37 AL1 and 5 AL2 (for value chain players), followed by commercial banks with 16 loans for farmers and 14 for value chain players. Next come the microfinance institutions, which offer 15 agricultural loans and 5 chain loans. Both types of loans are provided by all agricultural banks. As for the other institutional types, the agricultural loan offer is either minimal or absent since development banks or international funds provide these loans through other organizations or financial institutions including cooperatives and micro enterprises.
48 Table 24: Percentage of credit offered by type of financial institution
Table 24 shows that all agricultural banks, international funds, and NGOs offer credit to small-scale farmers in this database, although cooperatives and MFIs are more likely to use this form of credit. International funds are slightly less prominent in this database. In terms of agribusiness loans (AL2), only 50% of agricultural banks offer these services, 29% of commercial banks, 33% of development banks, and 24% of MFIs. 5.1.6. Gender Equality For gender equality, the 144 FIs sample covered 22 Credits facility for women (G1), 15 Career development opportunities to female staff (G2), and 43 Gender Programmes (G3). Generally, other institutional types have little direct interaction with VCs and are more concerned with regional development. Because of this, these institutions almost have no gender-related offerings. As a result of reviewing table 25, we can learn that 50% of agricultural banks and NGOs offer women-credit, 50% of nongovernmental organizations and 50% of state developmental banks provide gender equal employment opportunities and more than 50% of international funds, Islamic banks, and nongovernmental organizations provide assistance and programs to women.
49 Table 25: Percentage of gender equality program offered by type of financial institution
5.1.7. Digital Solutions In terms of digital solutions, we found that 60 FIs out of 144 offer Online Banking (DS1), 19 FIs offer E-Products (DS2), and 18 FIs offer Online Loan Applications (DS3). First place goes to the commercial banks with 37 DS1, 10 DS2, and 11 DS3. Cooperatives rank second, followed by MFIs and Islamic banks. The other typical institutions do not have a strong focus on digital solutions, whose offers are very limited. Table 26: Percentage of digital solutions offered by type of financial institution
The table shows that more than two thirds of commercial banks and Islamic banks offer online banking, that about 20% of MFIs, Islamic banks and commercial banks offer e-products, and that 40% of Islamic banks and 23% of commercial banks offer online loan applications.
50 5.2. Cluster Analysis Our Data Analytics work often requires a large dataset (144 observations of 12 variables), which are nevertheless similar to one another. Therefore, together with similar observations within a cluster, we may need to organize them in a few clusters. These Clustering techniques are used in such situations to identify segments within the data. The similarity and the difference between data observations (e.g., geographical variables and institutional types) can also be understood mathematically using distance metrics, and different segmentation solutions can then be proposed. This section will consider 2 types of clustering methods. We will first consider k-means clustering, then Hierarchical Clustering. 5.2.1. Confirm Data: Clustering can be done even when data are not metric; however, many statistical methods currently used for clustering require that the data themselves are metric: not only must the data be numbers themselves, but the numbers also have a numerical significance, as explained in section 3.3.4. This is required to compute distances between observations, and distances are usually computed only using metric data. However, it is possible to define distances also for non-metric data (e.g., continent, institutional type, agricultural credit, etc.). In our case, the data are metric, so the next step is to evaluate the descriptive statistics. Before moving forward, we check the descriptive statistics of the data to understand it better. Table 27: Descriptive statistics of the dataset
51 5.2.2. Scale the data The fact that some variables have very different ranges and scales can often lead to problems: the results can be largely shaped by a few large values. It is recommended to standardize the data, for instance by making some raw attributes have, for example, a mean of zero and a standard deviation of one, or to scale them between 0 and 1 to avoid such issues. After examining the statistical description of the data, and before proceeding with the clustering analysis, this step14 was carried out with the function(r). This step of scaling is achieved by dividing the values in every column by the corresponding 'scale' value from the argument if the value is numeric. If the value is not numeric, then the values are divided by the standard deviation or root-mean-square. In our case, each variable has a mean of zero and a standard deviation of one, as expected. A copy of the R script is attached in [Annex D]. 5.2.3. Select segmentation variables The choices of which variables to use for clustering are crucial decisions that will greatly influence the clustering solution. Every variable chosen should have a significant impact on clustering. This exploratory research provides an idea of which factors may differentiate regions, type, etc. In our case, we can use the 7 categories of variables (Continent, Institutional Type, Foundation, Number of branches, Agricultural credit, Gender equality, and Digital Solutions) for segmentation, and the remaining 3 (Total assets, Total equity, and Gross loan Portfolio) cannot be considered as the data are incomplete. 5.2.4. Define similarity measure: In clustering and segmentation, objects are related in some way. Most statistical methods for clustering include a measure of distance. For example, the Euclidean distance and the Manhattan distance are common measures. We will use K-means here, which is based implicitly on pairwise Euclidean distances between data points, and where the sum of squared deviations from centroid is equal to the sum of pairwise Euclidean distances divided by the number of points. 5.2.5. Number of clusters Clustering and segmentation can be done statistically in a number of ways, so it might make sense to try several approaches before finally selecting one that is statistically robust, interpretable, and actionable - among other aspects. 14 In the R script, this step is under the heading # scale data
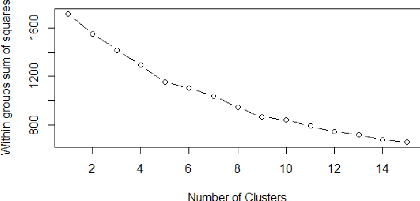
52 Throughout this study, we will utilize two widely used methods: the K-means Clustering Method, and the Hierarchical Clustering Method. Each method requires that we decide on how to measure distance/similarity between our observations. However, one difference to highlight is that K-means requires the user to specify the number of segments to create, whereas Hierarchical Clustering does not. First, let's look at the K-means method. WSSplot will be used to determine the optimum number of clusters. Below is the result of this function for the data scaled points.
Figure 12: Determination of the optimum number of clusters 5.2.6. K-means Clustering Method According to one of the most common typical cluster methods, the Euclidean distance of the observation can be used as a criterion for determining the optimum number of clusters. This option specifies how the distance between each observation point and the cluster center is calculated. This case will utilize the default Euclidean distance for measuring the distance between two points by using the length of the straight line between them. The 144 provided observation points will be clustered in 2, 4, 5 and 8 clusters respectively. The other algorithm parameters will remain the same except for the number of clusters. By segmenting the data, it will be possible to develop (potentially more refined) segment-specific insights.
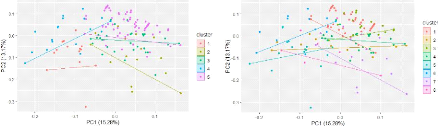
53 Data scaled Grouping in 2 Clusters Data scaled Grouping in 4 Clusters
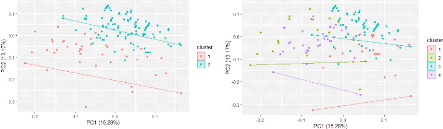
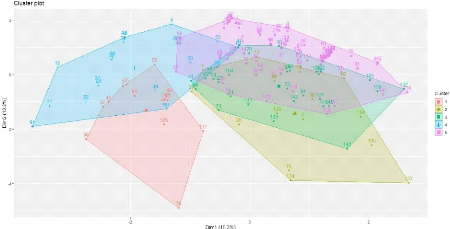
Data scaled Grouping in 5 Clusters Data scaled Grouping in 8 Clusters Figure 13: Grouping Data scaled in different clusters To visualize the relationship between the category's variables (C, T, F, B, AL1, AL2, G1, G2, G3, DS1, DS2, DS3), we demonstrate this with the function fviz_cluster as shown in the Figure 14 below.
Figure 14: Clusters Visualization
54 Using the function $cluster we can determine to which cluster belong each of these observations. Then, all data observations were clustered in four membership groups Table 28: Cluster membership IDs using K means method
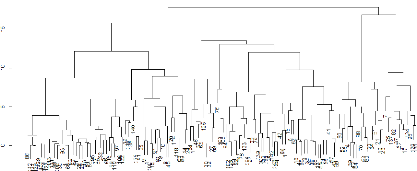
A second way to identify if there is a relationship is to use Hierarchical Clustering (next Section). 5.2.7. Hierarchical Clustering Method Hierarchical clustering figure out how many segments our data has. Additionally, this method gives a visual representation of how the data might be clustered. It produces a plot called the Dendrogram often helpful for visualization. For instance, in this case the dendrogram was based on the Euclidean distance metric and R's ward.D hierarchical clustering option is as follows:
Figure 15: Hierarchical Clustering As shown in the Dendrogram, clustering is accomplished by
aggregating observations by
55 groups into larger groups based on which groups are closest in proximity. Our data are merged eventually into one segment. According to the heights of the tree branches, the clusters that have merged at that level of the tree are very different one from the other. The longer lines indicate the differences between the clusters below. This method combines the closest data points/groups first, then the farthest, resulting in increased branches heights when you traverse the tree from the ends to the roots. Even with many observations, dendrograms can be useful for segmentation because, in general, branches grow logarithmically with data numbers. By analyzing the dendrograms, we can understand our data and the segments that exist in it better in practice. This Hierarchical Clustering found 4-segment solution (using Euclidean distance and hclust with option ward.D). All data observations were clustered in four membership groups. Table 29: Cluster membership IDs using Hierarchical method
5.2.8. Selected method and number of clusters The numbers above represent the clusters that our observations belong to when we use K-means method for 5 clusters and hierarchical method for 4 clusters, for the same total number of observations. Because we use different methods, we do not need the observations to be in the same clusters, nor do the segment profiles that we will find next (A comparison of IDs between both methods was done using four clusters). However, one feature of statistically robust Clustering is that the observations are segmented according to similar characteristics regardless of the methodology used. In other words, the segments' profiles should not vary too
56 much when we use different approaches or variations of the data. Therefore, the K-means clustering method will be our main focus. Using the WSSplot method (section 5.2.5), it is possible to determine the point where the kink in the curve may occur so that an optimum number of clusters can be determined. Another method15 is to run K-means Clustering from 1 to 10 and use the function betweenss_totss to compare and determine the best number of numbers. By crossing the hierarchy downwards, we can see that in the hierarchical method we will get different clusters, starting with 4 clusters at the height of 15, 8 clusters at the height of 10, 33 clusters at the height of 5, and even more clusters as the height becomes lower (figure 15). We will focus on K-means Clustering to avoid this unnecessarily large number of clusters. The difference between these two methods is that with K-means you can test, select, and verify the optimum number of clusters. However, if you choose a minimum height, when using the hierarchical method, the number of clusters may appear to be excessive. Moreover, it is found that the 5 segments found are relatively resistant to changes in data subsets and clustering methods. In general, the observations are grouped in the same clusters with no major changes. Segmentation is judged by the robustness of both the statistical characteristics as well as many qualitative criteria: institutional type, agricultural credit, gender, and digital solutions. This segmentation was validated using silhouette coefficient with the function silhouette to determine the robustness of our clustering. In this case, the silhouette width is understood as follows:
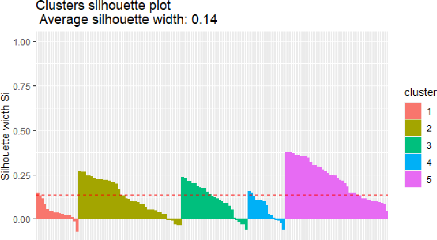
In this silhouette plot, there is no negative silhouette width, and the maximum value is greater than 0.14, indicating that our clustering using five groups is good. The method of mounting the clusters is always more reliable if the ratio is so close to 0.5. If, however, this method shows a significant result, the size of the clusters and the individuals differ from those determined by the previous method. 15 In the R script, this step is under the heading # Choosing K
Figure 16: Validation of the number of clusters
57 5.2.9. Extracting Results Having chosen five clusters, we want to learn more about who the financial institutions in these clusters are and how the segments can be interpreted. The data within each of the selected segments must be visualized and understood for this purpose. As a result, we can extract the clusters from the data and add them to our initial data to perform some descriptive analysis. To analyze each cluster, we will name it according to the most significant pattern, as shown below. Cluster Number Average Foundation Cluster Name 1 1948 Value chain oriented FIs 2 1967 Gender Staff FIs 3 1975 Farmer credit provider FIs 4 1990 Innovative digital newcomers 5 1982 Traditional Banking approaches Table 30: Nomination of the FIs groups
58 # Value chain oriented FI: This cluster has the highest average age in the sample and most financial institutions are African, with 14% coming from each Asia and South America. In addition, this sample consists of mainly commercial banks with a 68% share, 7% are cooperatives, and the same share is held by development banks. Located in the cluster are the oldest average foundation years 1948 and the most average number of agencies, 517. There is a high rate of agri-business and SME lending among these financial institutions, which funds actors in the value chain with an 86% percentage., therefore the value chain finance specialty in this segment. Moreover, 57% of the institutions in the sample provide agricultural credit to farmers, ranked 3rd among the clusters. In addition, 71% of these firms emphasize gender programs, but only 7% of them provide credit facilities for women, and like 3 other groups have do not invest in women's Equality staff. Among these FIs, 71% offer online banking, and half offer online loan applications. # Gender Staff FI: In terms of geographic location, this segment is very diverse, with half of the FIs coming from Africa, 13% from Asia, 20 % IFI, and 20% from South America. Concerning institutional type, cooperatives account for 40% of the sample, followed by MFIs at 27%, commercial banks at 13%, and state development banks, NGOs, and international financial institutions at 7% each. In this cluster, the average foundation year is 1967, younger than the cluster before, and the average number of branches is 433. As indicated above, the Gender Staff FI group is made up of FIs that 100% guarantee gender equality in the recruitment and selection of employees. Moreover, 47% of FIs offer credit facilities to women, and 13% offer gender-specific programmes such as workshops, events, and scholarships. In relation to rural lending, 67% of FIs offer agricultural loans to small farmers, while 20% lend to businesses. This segment is less digitally oriented, as only 47% offer online banking and 20% offer E-products, while 7% offer online loan applications. # Farmer credit provider FIs: The segment consists of 29 institutions, 28% from South America, 24% are IFI, 24% from Asia, and 24% from Africa. Regarding institutional types, cooperatives make up 31%, commercial banks 21%, MFIs 14%, and Islamic banks and development banks each make up 10%. A few other typical institutions include NGOs, international FIs, and international funds. There are 215 branches in this group on average and the average foundation year is 1975.
59 As far as rural lending goes, this cluster is the most extreme, where 72% FIs offer credits to small-scale farmers while 0% offer loan to agribusinesses. All financial institutions advocate gender equality and empower women through a range of programs. However, fewer than 7% of FIs offer credit to women, and there is no interest in offering employment opportunities to female staff. In terms of digital solutions, half of the FIs provide online banking, however, only 7% offer online loan applications. # Innovative digital newcomers This cluster has 19 financial institutions, 79% of which are from Africa and 21% from Asia. 68 percent are commercial banks, 16 percent are cooperatives, 11 percent are microfinance institutions, and 5 percent are Islamic banks. Compared to other groups, this group has a very small number of branches, 95 on average. In this cluster, the average FI foundation year is 1990, making it the youngest. There are the lowest bids for small farmers in this cluster, with 37% offering credit to farmers, 26% lending to value chain players, and gender equality isn't strongly addressed; 16% of small business loans go to women, and 11% promote gender programmes. Additionally, this group is characterized by digitalization as 84% of FIs offer online banking services, as well as other electronic products like SMS Banking, Email Banking, and Mobile Loans. Moreover, 37% of the FIs in this segment offer Online Loan Applications. # Traditional Banking approaches This last group, with the largest number of members, was made up of 48% Africans, 34% South Americans, 19% Asians, and 4% global. The most dominant institution type is cooperative, representing 42% of total institutions, followed by commercial banks, 16% of microfinance institutions, 7% of development banks, 3% of agricultural banks, and 1% for credit unions, insurance companies, international funds, Islamic banks, and nonprofits. FIs in this traditional cluster have an average age of 39 and 137 branches on average. This segment is the lower regarding bank services, where we found that half of this group offers agricultural credit for farmers, and 12% offer agribusiness credit. Gender-specific projects are not well supported by this group, only 13 provide women facility credit. Finally, the lower digital solutions offer with only 16% FIs offer online banking, 0% E-products, and 1% online loan application. Below is a summary of each cluster's most important characteristics. Table 31: Cluster's characteristics
60 Cluster Name
61 Average Foundation
6. Discussion 6.1. An information provider database The database provides a snapshot of financial institutions engaged in agricultural sectors in the Global South, including African, Latin American, Asian, and international financial institutions. The different kinds of institutions such as commercial banks, cooperatives, development banks, Islamic banks, cooperatives, and credit unions, as well as international funds and institutions, each finance the agricultural sector differently. As a result, the database can be used to determine the similarities and differences among these institutions and understand how financial institutions, make available offers in the agricultural sector to meet the needs of rural clients. There is a large amount of data that is available in the database from websites of financial institutions, starting with the geographical location and type of institution, which, in this case, do not appear to be correlated with the offer of agricultural loans in this case. Furthermore, the database listed the year the financial institute was founded to highlight the years of experience in banking on the one hand, and to determine whether this has any direct bearing on agriculture financing, but this is not the case in the present sample. As well, the number of branches of financial institutions and the relative importance of their dissemination in providing small-scale farmers with information and access to agricultural credit are not strongly linked in this database to agricultural credit offer. However, based on the literature review, it was indicated that rural areas were lacking an appropriate infrastructure, have no branches, or have a limited network which makes the rural fundraising situation more difficult (Langenbucher, 2005). Similarly, in other publications, low population densities, fewer bank branches and distant locations were cited as factors that reduce profitability of rural finance (IFC and World Bank, 2012). Among the other important categories of information contained in this database are the availability of agricultural credit for farmers as input financing, labor payment, and harvest and storage, as well as credit for agribusiness and agricultural SMEs. As cited in the literature review of (ISF Advisors and Mastercard Foundation, 2019; UNCTAD, 2004), this category of variables shows a financing gap for the agricultural sector, despite the use of the approach VCF by many FIs. This sample contains only a little over half of the institutions that provide agricultural credit, and even fewer when it comes to financial institutions that provide financing to value chain participants, not even one fifth. Regarding gender equality, observations show that not many gender programs are offered such as women's empowerment events, women's savings accounts, scholarships, workshops, 62 but when it comes to staff equality and credit for women, the available options are far from expectations. In terms of digital solutions, the database indicates that increasingly financial institutions rely on online banking; on the other hand, e-banking products such as SMS, Email, and Mobile Loans are less and less common, and are only used in countries where smart phones are not yet widely available. As for online loan applications, FIs are experimenting with this new method, but the products available are very limited. According to the literature, FIs can enhance their ability to offer competitive products by strengthening the relationship between producers and buyers, which will lead to more innovative products (Kaufman, Wood, & Theyel, 2000). Due to the inaccessibility of information on the part of farmers, and the low awareness of farmers' products by institutions, it is possible to argue that agricultural credit for small-scale farmers, as well as for value chain actors, exists in a weak and even random manner. Further, some financial institutions are reluctant to lend to the agricultural sector because of the lending risk as mentioned in the literature review (Herliana, Acip, Qorri, Qonita, & Nur, 2018). 6.2. Analysis of the clustering analysis In fact, when assessing the factors that could facilitate the development of agricultural loans, the cluster analysis has revealed that regardless of geographic location, age of the institution, and number of branches, financial institutions with value chain lending programs offer more agricultural credit to farmers and support women with a range of programs. The majority of these FIs offer Online Banking, in addition to online loan application. In fact, this analysis has also demonstrated that when financial institutions promote gender equity strongly or programs that support women either directly or indirectly, they immediately offer moderate credit for women, agricultural credit for small farmers, and several digital solutions. A key finding of the study is that financial institutions offer customized and enhanced rural financial services that are in high demand and in line with gender issues and digital solutions. This was shown by the results of cluster analyses for the first, second, and third segments with the names respectively of Value Chain FIs, Gender Staff FIs, and Farmer Credit Provider FIs. In contrast, when FIs provide low-level financial services and tend to use traditional banking methods, they do not promote gender equality or offer digital solutions, as shown in the cluster 5 (Traditional Banking approaches). Nevertheless, technology-oriented solutions are at the center of the most youthful cluster, with an average foundation year of 1990, hence the name Innovative digital newcomers. 63 Previously, the analysis looked at the variables of agricultural loans, women's equity, and digital solutions together. Keeping in mind that years of banking experience and number of branches may not be statistically significant. Findings indicate that commercial banks provide most of the credit to value chain approaches, while cooperatives are the most popular for agriculture loans, both with MFIs being gender equity-oriented organizations. As explained in the previous section, the dominance of commercial banks in the first segment Value chain oriented FIs and the fourth group Innovative digital newcomers in providing financial services and digital solutions may be explained by the fact that these types of institutions have the resources necessary to provide these services. While there are more individuals from these types of organizations may explain. Based on table 19, commercial banks, cooperatives, and microfinance institutions represent 81 percent of our simple. However, this database shows all agricultural banks, international funds, and NGOs offering loans to small farmers, although cooperatives and MFIs are most likely to use it. International funds appear less frequently than agricultural banks. Agribusiness loans are the exclusive domain of 50% of agricultural banks, 29% of commercial banks, and 33% of development banks as well as 24% of microfinance institutions according to the 144 FIs sample Additionally, table 21 shows that several FIs such as development bank are the least likely to provide agricultural loans. This could be because these institutions may be included as facilitators or brokers for several agricultural development projects. Furthermore, these institutions often provide financial aid through other financial institutions, and that is the major case for this sample of database according to the websites of FIs. 6.3. Limitations and further research needs The evaluation of the database provides valuable information about the potential for diversifying financial offerings and introducing innovative products that cater to rural clients' needs. First, this database was created based on an English literature review, so many financial institutions from North Africa, South America, and Asia were not considered. Second, the structure of the database causes some information to be lost due to specific categories of data being classified into. Consequently, some of the information cannot be considered. This information relates to farmer credit for instance, where several FIs divide this product into several categories such as input loans, fertilizer loans, harvest credit, etc....Nevertheless, other FIs include this type of credit under one category of farmer loan. Furthermore, 4 FIs from the 144 in the sample work with service providers or collect information 64 about farmers for credit risk screening purposes. These factors are collected and used to determine whether a farmer is credit worthy or not. However, this information is not considered since these FIs represent only 3% of the sample. Therefore, a deeper analysis must be conducted of an expanded and more diverse set of financial institutions taking into account this important information. Third, the data base also included several categories of variables, such as Total assets, Total equity, Gross loan portfolio, and number of clients. Since many websites did not have information on these variables, we did not take them into account. Consequently, these cannot be considered and high-level information, such as penetration rate, cannot be calculated at this point. Fourth, the lack of credible or official websites of many financial institutions, which reduced the sample by 50 FIs. This is rather than their significant role in funding VC initiatives as described in the bibliographic study. In order to address these issues, an online survey should be conducted with FIs representatives to gather the maximum amount of information necessary for analysis. In this regard, an online questionnaire is crucial to analyze the way in which FIs currently fund the agriculture sector, including the approach AVCF. Having a clear understanding of how FIs apply the AVCF is crucial on the one hand! On the other hand, it is essential to provide an accurate depiction of the AVCF's features and ways it can improve access to finance for all value chain players. Also, the foundation believes more research needs to be done on gender equality programs and their relationship to agricultural finance. A study is needed to determine whether promoting women's empowerment and gender equality can promote lending risk reduction and increase credit facilities in the agricultural sector. Though cluster analysis did not show a significant relationship between digital solutions and agricultural credit, evaluating how digital tools can be used to increase farmers' awareness of credit offers by financial institutions is a high priority. A weakness of the analysis is the neglect of some variables including geographical location (G), institutional type (T), and foundation year (F), and the number of branches (B) due to the use of the binary method of accreditation for the qualitative variables. Thus, after duplicating the agricultural loan variables into two variables (AL1 and AL2), gender equality into three variables (G1, G2, G3), and digital solutions into three variables (DS1, DS2, DS3), we arrived at 12 variables in total. As a result, cluster analyses were influenced by inequalities in importance, of which eight variables were essentially only three (although they were duplicated) while the remaining four, which are more numerous, were given less significance. 65 To rectify this, it is necessary to give coefficients for each category of variables, according to their significance. The purpose of this is to distinguish the order of relevance of the variables and help make the analysis more logical. 66 7. Conclusion and Recommendations 7.1. Conclusion Although FIs have introduced innovative services to help improve rural access to services, it is yet to be determined if these can contribute to increased access in the rural economy. Since the FIs' website does not contain other important information, such as number of clients, penetration rates, etc..., much attention has been given to agricultural loans, gender equality, and digital solutions in this study. First, this investigation was based on a database of 144 FIs from the literature review, including 67 FIs from Africa, 29 from Asia, 35 from South America, and 13 IFIs. An analysis of the financial institutions reveals that, internationally, 58 percent offer credit to farmers, and 19 percent offer credit to value chain actors. Moreover, there are no restrictions on the availability of credit for small-scale farmers among the agricultural banks, international funds, and NGOs in this database, although local cooperatives and microfinance institutions are more likely to offer it. This confirm the Hypothesis H1 that Various trends can be seen based on the variables concerning the provision of credit by different types of FIs in the Global South. Second, to enhance rural finance, there is a crucial need to ensure farmers have access to credit, promote the empowerment of women and promote the use of digital technology. It has been found that while 58 percent of FIs currently provide some type of agricultural credit, only 31 percent of FIs have programs geared toward empowering women, and 42 put digital solutions on the table. This statement answers the second research question and confirm the hypothesis H2, where not most FI deal with gender issues and offer digital solutions. In these circumstances, the FIs are limited in their ability to request rural financial services. In addition, the results of the study are only able to provide some indication on the number, availability, and link between agricultural loans, gender, and digital solutions, but not on their impact, and therefore cannot accurately assess the potential of those services in improving access to agriculture. Third, when examining the relationship between agricultural credit offers and the other variables, the differences and similarities between financial institutions could be determined through the method cluster analysis, which identified five clusters according to their main patterns. This cluster analysis classified all the observations into five groups, starting first with those who are value chain oriented. A second segment was corresponding with personnel with higher gender equality. The third segment mostly serves small farmers. Among the characteristics of the fourth cluster is its youthfulness and digital orientation. The fifth group 67 provides the minimum services due to its Traditional Banking approach. Analyzing the similarities and differences between these FIs provided an answer to the third research question as well as confirmed the hypothesis H3. In the study, the most available information in a financial institution's website is geographic location, institutional type, year of foundation, number of branches, agricultural loans offered, gender equity and digital solutions. However, cluster analysis reveals that this relationship with digital solutions was not statistically significant, even when financial institutions were high in digital solution rates. In addition, it was revealed that there were no differences in agricultural finance offers depending on the number of branches or years of banking experience. A critical feature of this database is that it offers a new outlook on rural finance services in the Global South. This is evidenced by rural financial institutions offering enhanced services designed in line with the needs of women. In addition to the finance gap in the agriculture sector, the limited adoption of digital products by FIs highlights a digital gap. Agricultural finance cannot be fully effective without more credit facilities for women, and innovative digital solutions. 7.2. Recommendations The analysis of the database contributes to broadening the understanding of the potential of credit provision, gender, and digital solutions in rural finance. In this sense, the assessment allows offering some recommendations for further analysis: As spoken by the professor Muhammed Yunus at the Australian Business Chambers Forum in Melbourne: ««While we celebrated, we noticed something. The money we gave to women was more effective. It did better to the family.»» In this regard, as part of the rural finance, farmer credit should not be considered as the single solution to the challenges that small-scale farmers face. In fact, gender could play a role in improving the farmers' access to credit but need to be supported by other factors that are determinant for the operation of these models such as digital tools. There is a need for digital solutions to cater to the needs of small farmers. Some e-products (Email Banking, SMS Banking) will enable farmers to manage and consult their accounts, transfer money easily. In addition, online credit applications can reduce transaction costs greatly. A database of information about farmers should be collected by FIs to ease the lending process. Another effective tool for improving rural finance is the AVCF, which reduces transaction costs, manages risks, and offers better opportunities to value chain actors. 68
References Abbas, A. C., Yuansheng, J., Feng, W. A., & Liu, D. (2017). Famers' access to credit: Does collateral. (A. Goodness, Ed.) Cogent Economics & Finance. doi: https://doi.org/10.1080/23322039.2017.1369383 Abid, A., Jie, S., Aslam, W., Batool, S., & Lili, Y. (2020). Application of structural equation modelling to develop a conceptual model for smallholder's credit access. The mediation of agility and innovativeness in organic food value chain finance. PLOS ONE, 15(8), e0235921. doi: https://doi.org/10.1371/journal.pone.0235921 Adams, D. W. (1994). Using contracts to analyse informal finance. (F. J. Bouman, & O. Hospes, Eds.) Financial landscapes reconstructed: The fine art of mapping development, 179-192. Adebayo, O. O., & G, A. R. (2008). Sources and Uses of Agricultural Credit by Small Scale Farmers inSurulere Local Government Area of Oyo State. Anthropologist, 10(4), 3134. AFD, INSE & IDFC. (2021, 07 20). Key Indicators by bank. Retrieved from Finance in Common: https://afdshiny.shinyapps.io/developmentbanksdatabase/ AfDB. (2013). Agricultural Value Chain Financing (AVCF) and Development for Enhanced Export Competitiveness (Vols. (Vol. 136) [E-book]). African Development Bank. AFRACA and FAO. (2020). Agricultural value chain finance innovations and lessons: Case studies in Africa. doi:10.4060/ca6345en Akpan, S. B., Patrick, I. V., Udoka, S. J., Offiong, E. A., Okon, U. E., & Comment, G. (2013). Determinants of Credit Access and Demand among Poultry Farmers in Akwa Ibom State, Nigeria. American Journal of Experimental Agriculture,, 3(2), 293 307. doi:10.9734/AJEA/2013/2810 Ali, J., & Kumar, S. (2011). Information and communication technologies (ICTs) and farmers' decision-making across the agricultural supply chain. 31(2), 149-59. Aliero, H. M., & Ibrahim, S. (2011). An analysis of farmers access to formal credit in the rural areas of Nigeria. African Journal of Agricultur al Research, 6(17). Anderson, J. (2017). National Survey and Segmentation of Smallholder Households in Bangladesh: Household Level Data. Ref: BGD_2016_SHS_v01_M. Washington, D.C: World Bank. Retrieved 8 1, 2021, from https://microdata.worldbank.org/index.php/catalog/2839/study-description#metadata-identification Antonaci, L., Demeke, M., & Vezzani, A. (2014). The challenges of managing agricultural price and production risks in sub-Saharan Africa. ESA Working paper, 14-09. Retrieved from http://www.fao.org/3/i3907ee/i3907ee.pdf Anwarul, H., & Prerna, T. (2015). Credit Policy for Agriculture in India - An Evaluation. (ICRIER, Ed.) Supporting Indian Farms the Smart Way: Rationalising Subsidies and Investments for Faster, Inclusive and Sustainable Growth. Arias, J. (2019). Financing and financial inclusion for agricultural and rural transformation. IICA.
70
Bibliography Asian Development Bank. (2012). Support for agricultural value chain development. (Manilla, Ed.) Brown, M. Z. (2010). The emergence of information sharing in credit markets. 19(2), 255-78. Buckley, G. (1997). Microfinance in Africa: Is it either a Problem or the Solution. World Development, 25(7), 1081-1093. Cao, Z., & Lumineau, F. (2015). Revisiting the interplay between contractual and relational governance: A qualitative and meta-analytic investigation. 33, 15-42. Carroll, T., Stern, A., Zook, D., Funes, R., Rastegar, A., & Lien, Y. (2012). Catalyzing smallholder agricultural finance. Washington, DC: Dalberg Global Development Advisors. CGAP. (2016). CGAP Smallholder Families Data Hub. Retrieved from Consultative Group to Assist the Poor: https://www.cgap.org/small_holders_data_portal/ Cheung, S. (1987). Economic organization and transaction costs. Coleman, B. E. (1999). The Impact of Group Lending in Northeast Thailand. Journal of Development Economics, 60, 105-141. Coon, J., Campion, A., & Wenner, M. (2010). Financing agriculture value chains in Central America (IDB). Washington, DC: Inter-American Development Bank. Crook, J. N. (1996). Credit scoring: An overview. The University of Edinburgh: Department of Business Studies. Cuevas, C., & Pagura. (2016). AGRICULTURAL VALUE CHAIN FINANCE A GUIDE FOR BANKERS. World Bank Group. Retrieved from https://www.mfw4a.org/sites/default/files/resources/Bankers_Guide_to_AVCF.pdf D'Espallier, B. (2012). Unsubsidized Microfinanoe Institutions. Economics Letters, 120(2). Da Silva, C. A., & Rankin, M. (2013). Contract farming for inclusive market access. Rome: Food and Agriculture Organization of the United Nations. Dados, N., & Connell, R. (2012). The Global South. American sociological Association, 11(1), 12-13. doi:10.1177/1536504212436479 Das, A., Senapati, M., & John, J. (2009). Impact of agricultural credit on agriculture production: An empirical analysis in India. Reserve Bank of India Occasional Papers, 2(30), 75-107. Diagne, A., & Zeller, M. (2001). Access to Credit and its Impacts in Malawi. Washington D.C: International Food Policy Research Institute. Dzadze, P., Osei, M. J., Aidoo, R., & Nurah, G. K. (2012). Factors determining access to formal credit in Ghana: A case study of smallholder farmers in the Abura Asebu Kwamankese district of central region of Ghana. Journal of Development and Agricultural Economics, 14, 416 423. Ellis, F. (1992). Ellis F. Agricultural policies in developing countries. FAO and ALIDE. (1996). Collateral in rural loans. Rome. Ferdinand, A., & Asmah, E. (2012, June). A Brief survey on the literature on microfinance and Agriculture. Ghana Social Science Journal, 9(1).
71
Bibliography Fries, B., & Akin, B. (2004). Value chains and their significance for addressing the rural finance challenge. MicroREPORT, Accelerated Microenterprise Advancement Project. Gamage, P. (2013). Determinants of access to bank finance for small and medium-sized enterprises: The case of Shri Lanka. Corporate Ownership and Control, 10(3), 402- 409. doi: https://doi.org/10.22495/cocv10i3c3art6 Gilbert, C. L. (2010). How to understand high food prices. J. Agric. Econ, 61, 398-425. Glassman, C. A., & Wilkins, M. H. (1997). Credit scoring: probabilities and pitfalls. J. Retail Banking Service,. Gonzalez, A., & Rosenberg, R. (2006). The State of Microfinance - Outreach, Profitability, and Poverty. Paper Presented at the Meeting Access to Finance: Building Inclusive Financial System. Washington, D.C: The World Bank. Gowhar, B. A., Ganie, A. H., & Padder, M. J. (2013). A study on institutional credit to agriculture sector in India. (B. U. Department of Economics, Ed.) International Journal of current research and academic review, 1(4), 72-80. Retrieved from www.ijcrar.com Grandori, A. F. (2019). Contracting for the unknown and the logic of innovation. 16(2), 413- 26. Harhoff, D., & Korting, T. (1998). Lending relationships in Germany- empirical evidence from survey data. J. Banking and Finance, 22, 1317-1353. Herliana, S., Acip, S., Qorri, A., Qonita, H. A., & Nur, L. (2018). The Constraints of Agricultural Credit and Government Policy Strategy. MATEC Web of Conferences, 215. doi:10.1051/matecconf/201821502008 Herliana, S., Sutardi, A., Aina, Q., Himmatul, A. Q., & Lawiyah, N. (2018). The Constraints of Agricultural Credit and Government Policy Strategy. MATEC Web of Conferences, 215, 02008. doi:10.1051/matecconf/201821502008 Honohan, & Beck. (2007). Making Finance Work for Africa,. Washington, D.C, 2007. Hult, G. H. (2004). Innovativeness: Its antecedents and impact on business performance. (Vol. 5). Ind Mark Manag. IFAD and CPI. (2020). IFAD, CPI, Chiriac, D., Naran, B., & Falconer, A. (2020, November). Examining the Climate Finance Gap for Small-Scale Agriculture. Climate Policy Initiative. https://www.ifad.org/documents/38714170/42157470/climate-finance-gap_smallscale_agr.pdf/34b2e25b-. Climate Policy Initiative. Retrieved from IFAD, CPI, Chiriac, D., Naran, B., & Falconer, A. (2020, November). Examining the Climate Finance Gap for https://www.ifad.org/documents/38714170/42157470/climate-finance-gap_smallscale_agr.pdf/34b2e25b- IFC and World Bank. (2011). Scaling Up Access to Finance for Agricultural SMEs Policy Review and Recommendations. 84(2011th ed). Retrieved from https://www.gpfi.org/sites/gpfi/files/documents/G20_Agrifinance_Report%20%28FINA L%20ONLINE%29.pdf IFC and World Bank. (2012). Innovative Agricultural SME Finance Models. Global Partnership for Financial Inclusion. (2012th ed., Vol. 116). International Finance Corporation & World Bank.
72
Bibliography Ijioma, J. C., & Osondu, C. K. (2015). Agricultural Credit Sources and Determinants of Credit, Acquisition by Farmers in Idemili Local Government. Journal of Agricultural Science and Technology. doi:doi: 10.17265/2161-6264/2015.01.004 Imtiaz SY, K. M. (2015). Telecom sector of Pakistan: Potential, challenges and business opportunities. 32(2), 254-8. ISF Advisors and Mastercard Foundation. (2019). Pathways to Prosperity. Rural and Agricultural Finance State of the Sector Report, 61. Retrieved from https://docplayer.net/209577056-Pathways-prosperity-rural-and-agricultural-finance-state-of-the-sector-report-november-2019.html Jones, G. E. (2015). Reconciling information gaps in organic farm borrowers' dealings with farm lenders. Agric Financ Rev, 75(4), 469-83. Kaboski, J. P., & Townsend, R. M. (2012). The Impact of Credit on Village Economies. American Economic Journal: Applied Economics, 4(2). Kaufman, A., Wood, C., & Theyel, G. (2000). Collaboration and technology linkages: a strategic supplier typology. 21(6), 649-63. Khan, N., Shafi, M. M., & Shah, M. (2011). Review of past literature on agriculture credit in rural area of Pakistan. Sarhad J. Agriculture, 27(1), 103-110. Kim, M., & Chai, S. (2017). The impact of supplier innovativeness, information sharing and strategic sourcing on improving supply chain agility. Global supply chain perspective, 187, 42-52. KIT and IIRR. (2010). Value chain finance: Beyond microfinance tor rural entrepreneurs. Royal Tropical Institute, Amsterdam; and International Institute of Rural Reconstruction, Nairobi. Royal Tropical Institute, Amsterdam; and International Institute of Rural Reconstruction, Nairobi. Klonner, S., & Rai, A. S. (2005). Adverse selection in credit markets. Evidence from South Indian bidding. Retrieved from http://eml.berkeley.edu/~webfac/emiguel/e271_s06/klonner.pdf Langenbucher, A. (2005). Warehouse receipt financing and related collateralized lending mechanisms. Background briefing material prepared for the Commodity Risk Management Group. Limsombunchai, V., Gan, C., & Lee, M. (2005). An Analysis of Credit Scoring for Agricultural Loans in Thailand. American Journal of Applied Sciences, 2(8), 1198-1205. Lu, F. (1999). Three Grain Surpluses-Evolution of China's Grain Price and Marketing Policies (1978-1999). Symposium on China's Agricultural Trade and Policy, 251-268. MapChart. (2021, 08 08). The Advanced World map adds political and geographical features to the basic World map. Retrieved from World Map: Advanced: https://mapchart.net/world-advanced.html Meyer, R. (2011). Subsidies as an instrument in agriculture finance: A review. The International Bank for Reconstruction and Development. The World Bank. Meyer, R. L. (2002). Track Record of Financial Institutions in Assisting the Poor in Asia. Retrieved from http://hdl.handle.net/11540/4154. License: CC BY 3.0 IGO
73
Bibliography Meyer, R. L. (2007). Analysing and financing value chains: Cutting edge developments in value chain analysis. Paper presented at the 3rd African Microfinance Conference: New Options for Rural and Urban Africa. Uganda. Miguel, D., & Silvana, P. (2007, 08 30). Commercial Banks and Microfinance. Munich Personal RePEc Archive. Retrieved from https://mpra.ub.uni-muenchen.de/10229/ Miller, C. (2012). Agricultural value chain finance strategy and design. Technical note. Agric value Chain Financ Strateg Des Tech note. Miller, C., & Jones, L. (2010). Agricultural value chain finance Tools and Lessons (Vols. 195 [E-book]). (P. A. Publishing, Ed.) United Kingdom: Food and Agriculture Organization of the United Nations. Retrieved from http://www.fao.org/3/i0846e/i0846e.pdf Morduch, J. (1999). The Role of Subsidies in Microfinance: Evidence from the Grameen Bank. Journal of Development Economics, 60(1). Mosley, P., & Hulme, D. (1998). Micro-enterprise Finance: Is there a Trade-off. Recent Research on Microfinance: Implications for Policy. Muiruri, E. (2007). Strategic partnership for fi nance. presentation at the AFRACA Agribanks Forum. Nyoro, J. (2007). Financing agriculture: Historical perspective. presentation at the AFRACA Agribanks Forum. Ololade, R. A., & Olagunju, F. I. (2013). Determinants of Access to Credit among Rural Farmers in Oyo. Global Journal of Science Frontier Research, 13(2), 8. Retrieved 07 21, 2021 Osuntogun, A. (1980). Some aspects of farm level credit use in Nigeria. World Agricultural Economics and Rural Abstracts. Pagano, M., & Jappelli, T. (1993). Information sharing in credit markets. 48(5), 1693-718. Pearce, D. (2003). Rural finance innovation case study. Buyer and supplier credit to farmers: Do donors have a role to play? (BASIS-CRSP) Conference on Paving the Way Forward for Rural Finance, (p. Paper presented at Broadening Access and Strengthening Input market Systems). Washington DC, USA. Petersen, M. A., & Rajan, G. R. (1994). The benefit of lending relationships: Evidence from small business data. J. Finance, 49, 3-38. Piñeiro, V. (2019). Financing and financial inclusion for agricultural and rural transformation. (MTID, Ed.) Research Gate, 3. Retrieved from https://www.researchgate.net/publication/338804997 Plata, V., & Nartea, G. N. (1998). Credit analysis procedures of rural lenders in Canterbury. Paper. New Zealand: Agril. and Resource Econ. Soc. Pradhan, N. C. (2013). Persistence of Informal Credit in Rural India: Evidence from All India Debt and Investment Survey and Beyond. Working paper No. 05. Robert, F., Chalmers, G., & Grover, D. (2012). Value Chain Finance Guide: . Tools for Designing Project Interventions that Facilitate Investment in Key Value Chain UpgradesACDI/VOCA,. Retrieved from http://www.fao.org/sustainable-food-value-chains/library/details/en/c/267130/
74
Bibliography Röttger, D. (2015). Agricultural finance for smallholder farmers: Rethinking traditional microfinance risk and cost management approaches. Salami, A., & Arawomo, D. F. (2013). Empirical Analysis of Agricultural Credit in Africa: Any Role for institutional Factors? Working Paper no.192,. Saqib, S. E., Kuwornu, K.M., J., Panezia, S., & Ubaid, A. (2018). Factors determining subsistence farmers' access to agricultural credit in flood-prone areas of Pakistan. Kasetsart Journal of Social Sciences, 39, 262-268. Simon, A., & Yaya, L. (2012). Improving innovation and customer satisfaction through systems integration. Singh, R. P. (2001). Rural credit and participation of credit agencies An analysis. Indian Cooperative Review, 38(4), 211-220. Song, H. Y. (2018). Financial service providers and banks' role in helping SMEs to access finance. Sriram, M. S. (2007). Productivity of Rural Credit. International Journal of Rural Management, 3(2), 245-268. doi:10.1177/097300520800300204 Svensson, G. (2001). Extending trust and mutual trust in business relationships towards a synchronised trust chain in marketing channels. Manag Decis. Swafford, P., Ghosh, S., & Murthy, N. (2006). A framework for assessing value chain agility. Int J Oper Prod. Int J Oper Prod Manag. Thai-Ha, L. (2020). Microfinance and Social Development: A Selective Literature Review. Fulbright University Vietnam, Fulbright School of Public Policy and Management. Asian Development Bank (ADB). Turvey, C., & Brown, R. (1999). Credit scores for a federal lending institution: The case of Canada's farm credit corporation. Agril. Finance(50), 47-57. UNCTAD. (2004, Novermber 16-17). Financing commodity based trade and development. Innovative agriculture financing mechanisms. Retrieved from tinyurl.com/y8azepg Vandeginste, B., Massart, D., Buydens, L., De Jong, S., Lewi, P., & Smeyers-Verbeke, J. (1998). Cluster analysis. Data Handling in Science and Technology, 57-68. doi:10.1016/s0922-3487(98)80040-3 Villalba, R., Venus, T., & Sauer, J. (2021). Agricultural Value Chain Financing: building a framework for an Ecosystem Approach. AARES Annual Conference. Australian Agricultural and Resource economics society. WBG & WFDFI. (2018). 2017 Survey of national development banks. Malaysia: world bank group. Wenner, M. (2006). Lecciones aprendidas en el fi nanciamiento de las cadenas agrícolas de valor: El caso del BID. presentation at the Latin American. WOCCU. (2009). Technical Guide Integrated Financing for Value Chains. Washington, DC: World Council of Credit Unions. WOCCU. (2021). Direct Members. Retrieved from World Council of Credit Unions: https://www.woccu.org/our_network/membership
75
Bibliography World Bank. (1975). Agriculture Credit Sector Policy Review. (W. Bank, Ed.) World Bank. (2007). Trade, Production, and Protection Database 1976-2004. The World Bank Economic Review. World Bank and CGAP. (2017, December 13). Smallholder Families Data Hub. (J. Anderson, Editor, & Consultative Group to Assist the Poor) Retrieved July 31, 2021, from CGAP: https://www.cgap.org/small_holders_data_portal/ Xie, H. L., He, Y. F., & Xie, X. (2017). Exploring the factors influencing ecological land change for China's. J. Clean. Prod., 142, 677-687. Xie, H. L., He, Y. F., Zou, J. L., & Wu, Q. (2016). Spatio-temporal difference analysis of cultivated land use intensity based on emergy in the Poyang Lake Eco-economic Zone of China. J. Geogr. Sci., 26, 1412-1430. Yadav, P., & Sharma, A. (2015). Literature, Agriculture Credit in Developing Economies: A Review of Relevant. International Journal of Economics and Finance, 7(12), from 219. doi:10.5539/ijef.v7n12p219 Yuan, Y., Hu, Y., & Gao, P. (2011, July 24-26). Farmers' choice and informal credit markets in China. Paper presented at the Agricultural & Ap plied Economics Association s 2011 AAEA & NAREA Joint Annual Meeting, Pittsburgh,Pennsylvania, July 24. Yunus, M. (2007). Creating a world without poverty. Social business and the future of capitalism. New York: Public Affairs. Yunus, M., & Jolis, A. (1999). Banker to the Poor: Micro-Lending and the Battle against World. Public Affairs. Zander, R. (1994). Barriers of credit access in rural Sri Lanka. (F. J. Bouman, & O. Hospes, Eds.) Financial landscapes reconstructed: The Fine Art of Mapping Development, 139-208. Zander, R. (2016). Risks and Opportunities of Non-Bank-Based Financing for Agriculture: the Case of Agricultural Value Chain Financing. Deutsches Institut für Entwicklungspolitik GmbH. Bonn: Deutsches Institut für Entwicklungspolitik and German Development Institute. Retrieved 07 18, 2021, from https://www.die-gdi.de/uploads/media/DP_7.2016.pdf Zhao, Q., Tsai, P.-H., & Wang, J.-L. (2019). Improving financial service innovation strategies for enhancing china's banking industry competitive advantage during the fintech revolution:. A Hybrid MCDM model, 11(5), 14-19. Zhou, K., & Poppo, L. (2010). Exchange hazards, relational reliability, and contracts in China: The contingent role of legal enforceability. 41(5), 861-81.
76
Bibliography Annex A CEO E-mail-form
I
|
| ||||||||||||||||||||||||||||||||||||||||||||||||||||||||||||||||||||||||||||||||||||||||||||||||||||||||||||||||||||||||||||||||||||||||||||||||||||||||||||||||||||||||||||||||||||||||||||||||||||||||||||||||||||||||||||||||||||||||||||||||||||||||||||||||||||||||||||||||||||||||||||||||||||||||||||||||||||||||||||||||||||||||||||||||||||||||||||||||||||||||||||||||||||||||||||||||||||||||||||||||||||||||||||||||||||||||||||||||||||||||||||||||||||||||||||||||||||||||||||||||||||||||||||||||||||||||||||||||||||||||||||||||||||||||||||||||||||||||||||||||||||||||||||||||||||||||||||||||||||||||||||||||||||||||||||||||||||||||||||||||||||||||||||||||||||||||||||||||||||||||||||||||||||||||||||||||||||||||||||||||||||||||||||||||||||||||||||||||||||||||||||||||||||||||||||||||||||||||||||||||||||||||||||||||||||||||||||||||||||||||||||||||||||||||||||||||||||||||||||||||||||||||||||||||||||||||||||||||||||||||||||||||||||||||||||||||||||||||||||||||||||||||||||||||||||||||||||||||||||||