Conclusion
103
Conclusion
Conclusion
In this study our main purpose is to have very thin coating
with high mechanical and thermal properties ( hardness and low friction
coefficient) in order to use it in the car industry to limit the energy losses
by friction between the piston and the cylinder , the used samples are taken
from a real piston to have more realistic results.
In the way of searching to upgrade the mechanical
characteristics of ordinary surfaces (the wear and the abrasive resistance ),
we chose to deposit a thin layer based on titanium and tungsten in a medium
containing 5% of nitrogen gas and the rest is argon gas, the choice in its se
is innovative because this coating is not a very well-known one in the
industrial field , the combination of titanium which is relatively a light
material with excellent corrosion resistance and in the other side the hardness
of the tungsten and its very high melting point provide the necessary
improvement for the engine pistons to reach a very high efficiency .
We noticed that The thin film layer grow mainly from a
nanoparticles with a diameter less than 1um, the interaction of this
nanoparticles with each other form a micro particles called clusters, the
growth of this clusters will form a columnar structure which will end by
creating a granular structure with an inter-granular space which is in direct
relation with the used energy and the deposition speed.
The measurement of the thin film thickness indicate that the
deposition speed have a value of 0.30nm/s which is a very high speed if we take
in consideration that the diameter of the atoms is a few Angstroms , so the
growth of the thin film layer is taking place by accumulation of macro
molecules with different orientation on the top of the surface which will cause
a none Crystallographic alignment to appear, so in order to have a uniform
structure we recommend to increase the energy of deposition in in order to
break the molecules bond to a small one which will increase significantly the
density and the porosity of the thin film enabling us to reach a higher
mechanical and thermal properties
The obtained structure present a low hardness of 2 Gpa with a
value of 0.9 for the friction coefficient which is very good if we take in
consideration that the deposited thin layer have an amorphous and heterogeneous
structure and low density.
Even if the result of the Ti-W-N thin layer deposited on a
sample of aluminum -silicon sample are not what we hoped for because they
didn't reach the hardness of the usual hard thin films, in the other side the
samples of stainless steel with the same deposition condition of temperature
and pressure gave much greater value than the aluminum samples
104
Conclusion
In order to a better characterization of the surface we
established a corrosion test for the samples with and without thin layer , the
results were significant , and they confirmed the previous results , the
corrosion rate for the coated area were much greater than the bare ones which
is mainly due to the high porosity of the surface
This study enable us to break into the nanomaterials world and
to discover the and to discover the large potential of this field and for our
study it's still promising in order to achieve the hardness of the ultra-hard
materials, and also the part that we didn't get into it which is the thermal
conductivity of the surface mainly because the lack of the necessary equipment
to measure the thermal conductivity which is a very important parameter to
determine if the coating represent a thermal barrier between the combustion
chamber and the aluminum piston, and if its right it will decrease the energy
losses through the piston enabling us to reach high thermal efficiency.
Appendices
AI 2
Appendix I: nanoindentation loading-unloading
curves
Appendix I: Nanoindentation loading-unloading
curves
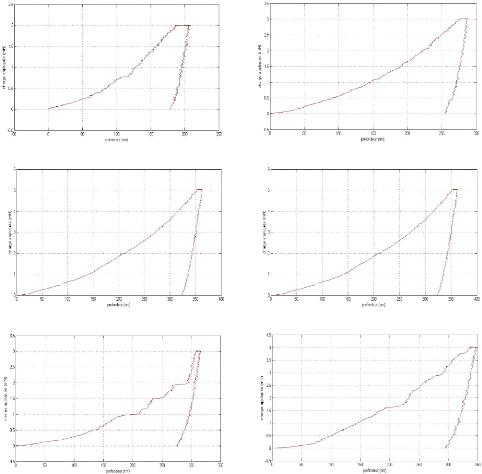
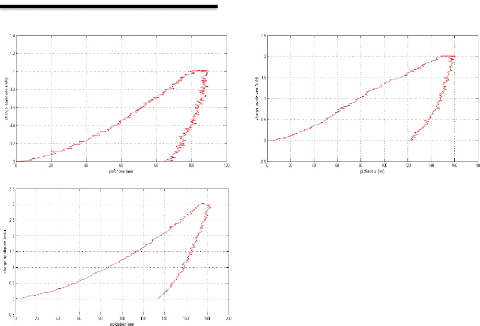
1. Aluminum-silicon without a layer
Appendix I: nanoindentation loading-unloading
curves
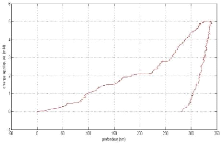
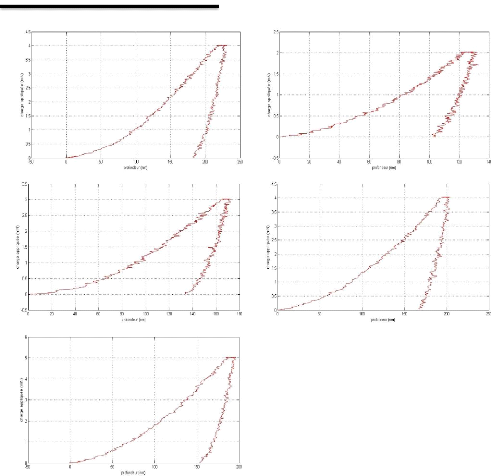
Fig.I.1: loading-unloading curves for 7 tests of
aluminum-silicon sample without a layer
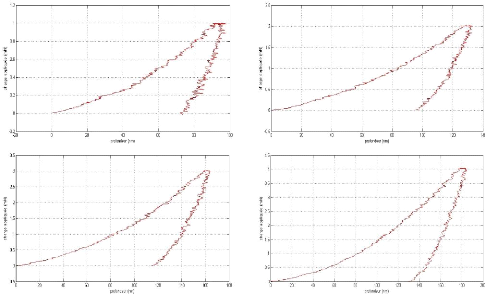
2. Aluminum-silicon with a Ti-W-N layer
AI 3
AI 4
Appendix I: nanoindentation loading-unloading
curves
Appendix I: nanoindentation loading-unloading
curves
AI 5
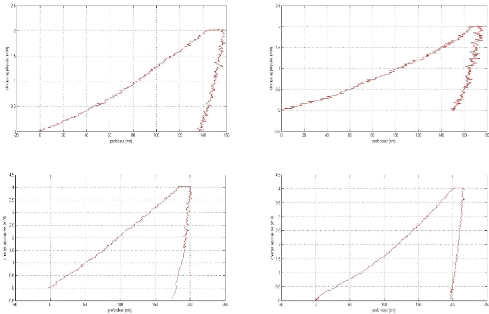
Fig.I.2: loading-unloading curves for 15 tests of
aluminum-silicon sample with a Ti-W-N layer
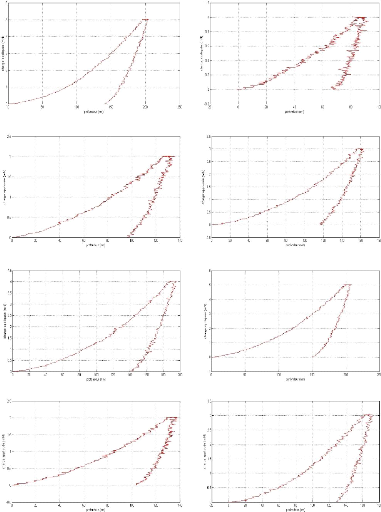
3. Stainless steel with a Ti-W-N layer
AI 6
Appendix I: nanoindentation loading-unloading
curves
AI 7
Appendix I: nanoindentation loading-unloading
curves
Appendix I: nanoindentation loading-unloading
curves
AI 8
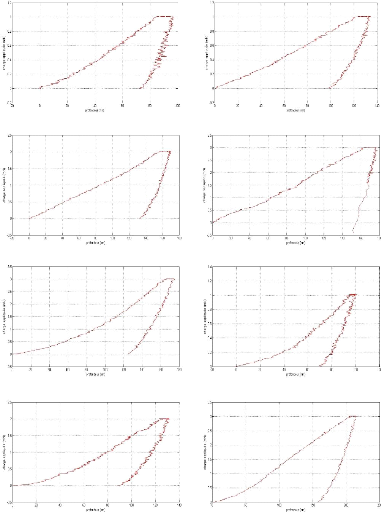
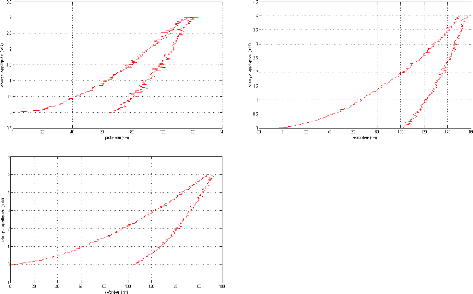
Fig.I.3: loading-unloading curves for 25 tests of stainless
steel sample with a Ti-W-N layer
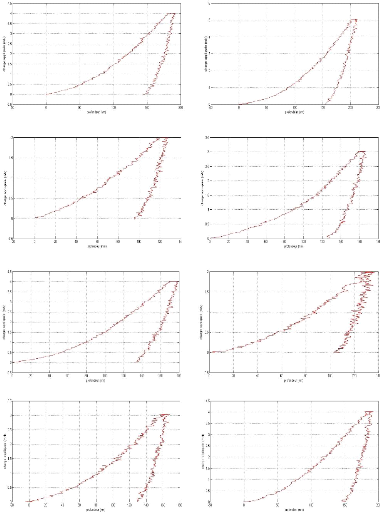
4. Stainless steel with double layers of Al-Si and
Ti-W-N

Appendix I: nanoindentation loading-unloading
curves
AI 9
Fig.I.4: loading-unloading curves for 05 tests of stainless
steel sample with double layers of Al-Si and Ti-W-N
AII 1
Appendix II: Nanoindentation results
Appendix II: Nanoindentation results
1. Aluminum-silicon without a layer
|
Tests
|
Modulus of elasticity E (GPa)
|
Hardness H (MPa)
|
Hardness HV
|
|
#01
|
95.921
|
2550.3
|
236.18
|
|
#02
|
100.03
|
2105.9
|
100.03
|
|
#03
|
115.81
|
2615.5
|
242.23
|
|
#04
|
101.34
|
2309.9
|
213.93
|
|
#05
|
86.902
|
1774.4
|
164.33
|
|
#06
|
69.493
|
2051.5
|
189.99
|
|
#07
|
101.67
|
2615.5
|
242.23
|
Table II.1 results of 7 tests of the aluminum-silicon
sample without layer
2. Aluminum-silicon with a Ti-W-N layer
|
Tests
|
Modulus of elasticity E (GPa)
|
Hardness H (MPa)
|
Hardness HV
|
|
#01
|
150.87
|
4214
|
390.26
|
|
#02
|
89.186
|
3795.2
|
351.48
|
|
#03
|
184.44
|
6037
|
559.09
|
|
#04
|
316.43
|
4546.2
|
421.03
|
|
#05
|
109.92
|
6358.7
|
588.89
|
|
#06
|
142.71
|
6218.1
|
575.86
|
|
#07
|
109.32
|
3810.1
|
352.86
|
|
#08
|
153.16
|
5774.6
|
534.79
|
|
#09
|
112.85
|
5957.7
|
551.75
|
|
#10
|
103.58
|
6354.5
|
588.49
|
|
#11
|
117.62
|
7143
|
661.52
|
|
#12
|
79.703
|
4012.2
|
371.57
|
|
#13
|
121.8
|
4289.5
|
397.25
|
AII 2
Appendix II: Nanoindentation results
|
#14
|
127.34
|
4149
|
384.24
|
|
#15
|
106.49
|
5476.3
|
507.17
|
Table II.2 results of 15 tests on the aluminum-silicon bar
with a Ti-W-N layer
3. Stainless steel with a Ti-W-N layer
|
Tests
|
Modulus of elasticity E (GPa)
|
Hardness H (MPa)
|
Hardness HV
|
|
#01
|
125.53
|
6187.7
|
573.05
|
|
#02
|
131.93
|
6494
|
601.41
|
|
#03
|
118.86
|
6714.9
|
621.87
|
|
#04
|
142.77
|
7271.3
|
673.4
|
|
#05
|
138.92
|
7634.4
|
707.03
|
|
#06
|
122.4
|
7072
|
654.95
|
|
#07
|
113.57
|
6949.6
|
643.61
|
|
#08
|
128.51
|
6735.1
|
623.74
|
|
#09
|
134.99
|
6289.6
|
582.49
|
|
#10
|
162.25
|
7032
|
651.24
|
|
#11
|
145.59
|
5856.7
|
542.4
|
|
#12
|
128.83
|
6301.8
|
583.61
|
|
#13
|
176.64
|
6328.8
|
586.12
|
|
#14
|
148.6
|
6880.3
|
637.19
|
|
#15
|
158.82
|
7079.3
|
655.62
|
|
#16
|
160.43
|
6146.1
|
569.19
|
|
#17
|
175.3
|
7308.6
|
676.85
|
|
#18
|
115.72
|
6513.4
|
603.21
|
|
#19
|
149.03
|
6701.1
|
620.6
|
|
#20
|
145.26
|
6627.9
|
613.81
|
|
#21
|
147.96
|
5767.6
|
534.15
|
|
#22
|
155.61
|
6252.9
|
579.09
|
|
#23
|
159.42
|
5783.1
|
535.58
|
AII 3
Appendix II: Nanoindentation results
|
#24
|
148.23
|
5736.4
|
531.26
|
|
#25
|
239.02
|
7450
|
689.96
|
Table.II.3 results of 25 tests on the stainless steel bar
with a Ti-W-N layer
4. Stainless steel with double layers of Al-Si and
Ti-W-N
|
Tests
|
Modulus of elasticity E (GPa)
|
Hardness H (MPa)
|
Hardness HV
|
|
#01
|
151.25
|
8561.6
|
792.9
|
|
#02
|
143.94
|
8780.6
|
813.18
|
|
#03
|
164.64
|
17172
|
1590.3
|
|
#04
|
161.26
|
10408
|
963.9
|
|
#05
|
149.71
|
11397
|
1055.5
|
Table.5.4 results of 05 tests on the stainless steel bar
with double layers of Al-Si and Ti-W-N
| 


