3.2.2 Results of section Two: Course Organization
Question 5: What are the skills that are given
more importance?( you can tick more than one answer).

100%
40%
90%
80%
70%
60%
50%
30%
20%
10%
0%
Listening Speaking Reading writing
100%
100%
83,3%%
83,3%
Listening Speaking Reading writing
Diagram 18: The Skills that are given more
Importance
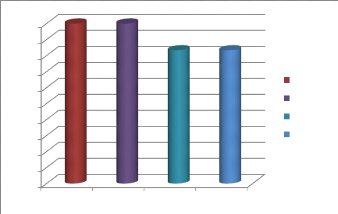
The statistics in diagram 16 indicate that all the teachers
give importance to the listening and speaking skills. Furthermore, 83.3%
believe that reading as well as writing skills should also be given a great
importance.
Question 6: During your present teaching, do you
use : ( You can tick more than one answer)
a. textbooks related to general English.
b. textbooks related to Business English.
41
c. materials you prepare yourself (texts, exercises, etc ).
42
The Presentation of the Findings

100,00%
80,00%
60,00%
40,00%
20,00%
0,00%
83,3%
A
100%
B
16.7%
C
%
A
B
C
Diagram 19: The Teaching Materials
Used
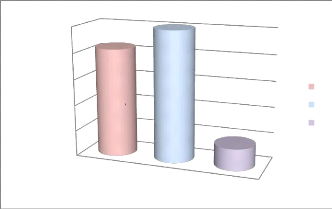
The results in diagram 19 indicate that all the teachers rely
on textbooks related to Business English in their teaching process. A huge
majority of them, which corresponds to 83.3%, also use textbooks related to
general English in order to support their teaching. Only 16.7% of the teachers
use materials they prepare themselves.
Question 7: Do you use authentic materials while
teaching?
|
Yes
|
No
|
Total
|
|
Number of Participants
|
6
|
0
|
6
|
|
Percentage
|
100 %
|
0 %
|
100%
|
Table 11: The Use of Authentic
Materials
Table 12 denotes that 100% of the teachers at the INPED do use
authentic materials in their teaching process.
Question 8: Do you think your role as a teacher
is:
a. To identify and sort out learners' goals of
learning.
b. To conduct a research in order to design a course.
c. Both.
43
The Presentation of the Findings

100%
40%
80%
60%
20%
0%
A B C
0% 0%
100%
Diagram 20: The Role of the Teacher
As presented in diagram20, 100% of the teachers affirm that their
role as a teacher is both to identify and sort out learners' goals of
learning, as well as to conduct research in order to design
courses.
Question 9: a- Do you evaluate the learners'
achievement?
|
Yes
|
No
|
Total
|
|
Number of Participants
|
6
|
0
|
6
|
|
Percentage
|
100 %
|
0 %
|
100%
|
Table 12: Evaluation of Learners'
Achievement
The table above shows that 100% of the teachers do
evaluate the learners' achievement
b- If yes , when?
a. At the beginning of the unit.
b. At the end of an instructional unit.
c. At the end of a semester.
d. Every day.
44
The Presentation of the Findings

16,7%
83,3%
A
B
C
D
Diagram 21: Period of Testing
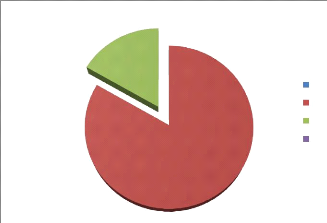
As it is noticed in diagram 21, 83.3% of the teachers evaluate
their learners at the end of an instructional unit, 16.7% evaluate them at the
end of each semester. No one of the teachers evaluates the learners at the
beginning of the unit nor every day.
Question 10: As an evaluator, do you evaluate
yourself after each course?
|
Yes
|
No
|
Total
|
|
Number of Participants
|
6
|
0
|
6
|
|
Percentage
|
100 %
|
0 %
|
100%
|
Table 13: Teachers' self-evaluation
As displayed in the table above 100% of the teachers do
evaluate themselves after each course. That is, all of them evaluate their
teaching method after the end of a course.
Question 11: Do you collaborate With other
teachers in order to create a suitable course content?
The Presentation of the Findings

16.7%
83.3%
Yes No
Diagram 22: Teachers' Collaboration with other
Teachers
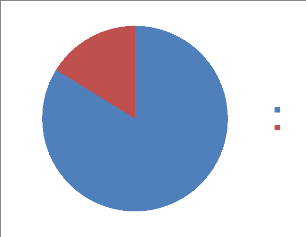
From the results of diagram 22, it is noticeable that 83.3% of
the teachers collaborate with other colleagues so as to create a suitable
course content for the learners. Nevertheless, a small minority which
corresponds to 16.7% do not work in collaboration with other teachers.
Question 12: Do you think that your teaching
method leads to better results ?
|
Yes
|
No
|
Total
|
|
Number of Participants
|
6
|
0
|
6
|
|
Percentage
|
100 %
|
0 %
|
100%
|
Table14: Teachers' Opinion about their Teaching
Method
The table above indicates that all the teachers are satisfied by
the teaching methods they use for teaching and argue that it has led to good
results.
| 


