Chapitre 27
Chapitre 28 ANNEXE II: Diagnostique des différents modèles (test
for appropriateness of models)
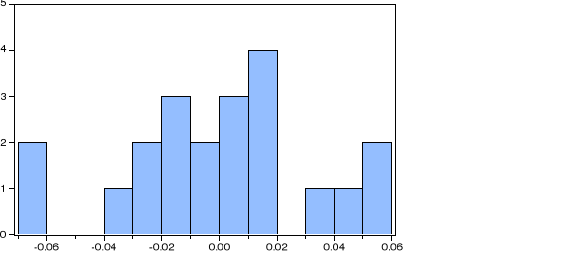
i) EA / PIB
-Test de normalité
Prob de Jarque Bera (0.989)> 0.01, 0.05, & 0.1
- Test de l'autocorrélation
|
Breusch-Godfrey Serial Correlation LM Test:
|
|
|
|
|
|
|
|
|
|
|
|
|
F-statistic
|
0.101556
|
Prob. F(2,13)
|
0.9041
|
|
Obs*R-squared
|
0.323058
|
Prob. Chi-Square(2)
|
0.8508
|
|
|
|
|
|
|
|
|
|
|
- Test de
l'hétéroscédasticité
|
Heteroskedasticity Test: ARCH
|
|
|
|
|
|
|
|
|
|
|
|
|
|
F-statistic
|
0.287468
|
Prob. F(1,18)
|
0.5984
|
|
Obs*R-squared
|
0.314388
|
Prob. Chi-Square(1)
|
0.5750
|
|
|
|
|
|
|
|
|
|
|
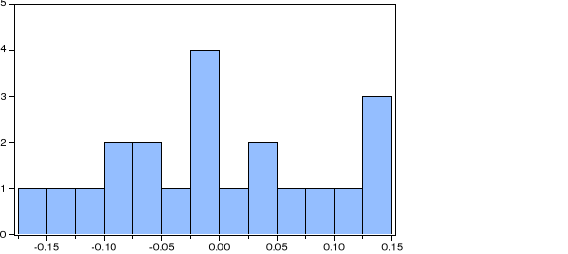
ii) EI / PIB
- Test de normalité
- Test de l'autocorrelation
|
Breusch-Godfrey Serial Correlation LM Test:
|
|
|
|
|
|
|
|
|
|
|
|
|
F-statistic
|
1.063727
|
Prob. F(2,11)
|
0.3782
|
|
Obs*R-squared
|
3.241230
|
Prob. Chi-Square(2)
|
0.1978
|
|
|
|
|
|
|
|
|
|
|
- Test de
l'hétéroscédasticité
|
Heteroskedasticity Test: ARCH
|
|
|
|
|
|
|
|
|
|
|
|
|
|
F-statistic
|
0.225975
|
Prob. F(1,18)
|
0.6402
|
|
Obs*R-squared
|
0.247970
|
Prob. Chi-Square(1)
|
0.6185
|
|
|
|
|
|
|
|
|
|
|
|
|
|
|
|
iii)ES / PIB
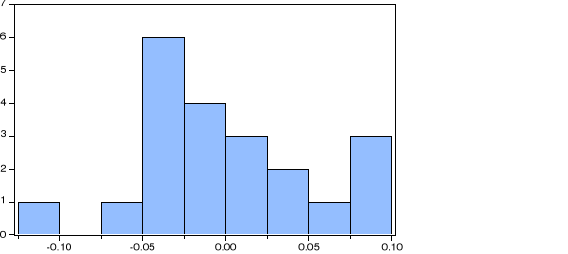
- Test de normalité
- Test de l'autocorrélation
|
Breusch-Godfrey Serial Correlation LM Test:
|
|
|
|
|
|
|
|
|
|
|
|
|
F-statistic
|
0.532162
|
Prob. F(2,13)
|
0.5996
|
|
Obs*R-squared
|
1.589183
|
Prob. Chi-Square(2)
|
0.4518
|
|
|
|
|
|
|
|
|
|
|
- Test de
l'hétéroscédasticité
|
Heteroskedasticity Test: ARCH
|
|
|
|
|
|
|
|
|
|
|
|
|
|
F-statistic
|
0.569097
|
Prob. F(1,18)
|
0.4604
|
|
Obs*R-squared
|
0.612951
|
Prob. Chi-Square(1)
|
0.4337
|
|
|
|
|
|
|
|
|
|
|

iv)ET / PIB
- Test de normalité
- Test de l'autocorrélation
|
Breusch-Godfrey Serial Correlation LM Test:
|
|
|
|
|
|
|
|
|
|
|
|
|
F-statistic
|
0.242227
|
Prob. F(2,11)
|
0.7890
|
|
Obs*R-squared
|
0.843668
|
Prob. Chi-Square(2)
|
0.6558
|
|
|
|
|
|
|
|
|
|
|
- Test de
l'hétéroscédasticité
|
Heteroskedasticity Test: ARCH
|
|
|
|
|
|
|
|
|
|
|
|
|
|
F-statistic
|
0.014510
|
Prob. F(1,17)
|
0.9055
|
|
Obs*R-squared
|
0.016203
|
Prob. Chi-Square(1)
|
0.8987
|
|
|
|
|
|
|
|
|
|
|
Chapitre 29 ANNEXE
III :Résultats des tests d'hypothèse
a) Résultat de l'estimation de
l'élasticité point de l'emploi total par rapport au
PIB
|
Dependent Variable: LNET
|
|
|
|
Method: Least Squares
|
|
|
|
Date: 05/18/13 Time: 23:35
|
|
|
|
Sample: 1 21
|
|
|
|
|
Included observations: 21
|
|
|
|
|
|
|
|
|
|
|
|
|
|
Variable
|
Coefficient
|
Std. Error
|
t-Statistic
|
Prob.
|
|
|
|
|
|
|
|
|
|
|
|
C
|
3.160396
|
0.433366
|
7.292677
|
0.0000
|
|
LNPIB
|
0.229081
|
0.130903
|
1.750005
|
0.0994
|
|
LNPIBD
|
0.186352
|
0.069534
|
2.680012
|
0.0169
|
|
D01
|
0.130792
|
0.065153
|
2.007447
|
0.0631
|
|
LNSR
|
0.032972
|
0.018154
|
1.816245
|
0.0894
|
|
LNOPEN
|
0.038070
|
0.021833
|
1.743719
|
0.1017
|
|
|
|
|
|
|
|
|
|
|
|
R-squared
|
0.845475
|
Mean dependent var
|
4.177657
|
|
Adjusted R-squared
|
0.793966
|
S.D. dependent var
|
0.022343
|
|
S.E. of regression
|
0.010142
|
Akaike info criterion
|
-6.109354
|
|
Sum squared resid
|
0.001543
|
Schwarz criterion
|
-5.810919
|
|
Log likelihood
|
70.14822
|
Hannan-Quinn criter.
|
-6.044586
|
|
F-statistic
|
16.41431
|
Durbin-Watson stat
|
2.224262
|
|
Prob(F-statistic)
|
0.000013
|
|
|
|
|
|
|
|
|
|
|
|
|
|
b) résultat de l'estimation de
l'élasticité point de l'emploi agricole par rapport au
PIB
EA / PIB
|
Dependent Variable: LNEA_
|
|
|
|
Method: Least Squares
|
|
|
|
Date: 05/18/13 Time: 23:27
|
|
|
|
Sample: 1 21
|
|
|
|
|
Included observations: 21
|
|
|
|
|
|
|
|
|
|
|
|
|
|
Variable
|
Coefficient
|
Std. Error
|
t-Statistic
|
Prob.
|
|
|
|
|
|
|
|
|
|
|
|
C
|
6.999476
|
1.640594
|
4.266429
|
0.0007
|
|
LNPIB
|
0.011261
|
0.001576
|
7.145304
|
0.8720
|
|
LNPIBD
|
0.285654
|
0.107522
|
2.656718
|
0.0179
|
|
D01
|
0.703532
|
0.246652
|
2.852332
|
0.0121
|
|
LNSR
|
-0.087939
|
0.068725
|
-1.279592
|
0.2201
|
|
LNOPEN
|
-0.115571
|
0.082652
|
-1.398289
|
0.1824
|
|
|
|
|
|
|
|
|
|
|
|
R-squared
|
0.909513
|
Mean dependent var
|
4.126029
|
|
Adjusted R-squared
|
0.879350
|
S.D. dependent var
|
0.110534
|
|
S.E. of regression
|
0.038394
|
Akaike info criterion
|
-3.446891
|
|
Sum squared resid
|
0.022111
|
Schwarz criterion
|
-3.148456
|
|
Log likelihood
|
42.19235
|
Hannan-Quinn criter.
|
-3.382123
|
|
F-statistic
|
30.15383
|
Durbin-Watson stat
|
1.776572
|
|
Prob(F-statistic)
|
0.000000
|
|
|
|
|
|
|
|
|
|
|
|
|
|
c) Résultat de l'estimation de
l'élasticité point de l'emploi industriel par rapport au
PIB
EI / PIB
|
Dependent Variable: LNEI
|
|
|
|
Method: Least Squares
|
|
|
|
Date: 05/18/13 Time: 23:29
|
|
|
|
Sample: 1 21
|
|
|
|
|
Included observations: 21
|
|
|
|
|
|
|
|
|
|
|
|
|
|
Variable
|
Coefficient
|
Std. Error
|
t-Statistic
|
Prob.
|
|
|
|
|
|
|
|
|
|
|
|
C
|
5.126080
|
4.454947
|
1.150649
|
0.2679
|
|
LNPIB
|
0.528658
|
3.245710
|
0.162879
|
0.0728
|
|
LNPIBD
|
1.201930
|
0.291969
|
4.116636
|
0.0009
|
|
D01
|
2.675203
|
0.669770
|
3.994215
|
0.0012
|
|
LNSR
|
-0.205220
|
0.186618
|
-1.099678
|
0.2888
|
|
LNOPEN
|
0.644729
|
0.224437
|
2.872646
|
0.0116
|
|
|
|
|
|
|
|
|
|
|
|
R-squared
|
0.866407
|
Mean dependent var
|
2.336080
|
|
Adjusted R-squared
|
0.821876
|
S.D. dependent var
|
0.247024
|
|
S.E. of regression
|
0.104256
|
Akaike info criterion
|
-1.448977
|
|
Sum squared resid
|
0.163040
|
Schwarz criterion
|
-1.150542
|
|
Log likelihood
|
21.21426
|
Hannan-Quinn criter.
|
-1.384209
|
|
F-statistic
|
19.45621
|
Durbin-Watson stat
|
1.813071
|
|
Prob(F-statistic)
|
0.000004
|
|
|
|
|
|
|
|
|
|
|
|
|
|
d) Résultat de l'estimation de
l'élasticité point de l'emploi dans les services par rapport au
PIB
ES / PIB
|
Dependent Variable: LNES
|
|
|
|
Method: Least Squares
|
|
|
|
Date: 05/18/13 Time: 23:31
|
|
|
|
Sample: 1 21
|
|
|
|
|
Included observations: 21
|
|
|
|
|
|
|
|
|
|
|
|
|
|
Variable
|
Coefficient
|
Std. Error
|
t-Statistic
|
Prob.
|
|
|
|
|
|
|
|
|
|
|
|
C
|
0.941793
|
2.482663
|
0.379348
|
0.7097
|
|
LNPIB
|
2.111902
|
0.559076
|
3.777481
|
0.0018
|
|
LNPIBD
|
0.193797
|
0.162709
|
1.191061
|
0.0521
|
|
D01
|
0.488721
|
0.373251
|
1.309365
|
0.2101
|
|
LNSR
|
0.070715
|
0.103999
|
0.679959
|
0.5069
|
|
LNOPEN
|
0.071125
|
0.125075
|
0.568658
|
0.5780
|
|
|
|
|
|
|
|
|
|
|
|
R-squared
|
0.922660
|
Mean dependent var
|
3.340653
|
|
Adjusted R-squared
|
0.896880
|
S.D. dependent var
|
0.180928
|
|
S.E. of regression
|
0.058100
|
Akaike info criterion
|
-2.618344
|
|
Sum squared resid
|
0.050634
|
Schwarz criterion
|
-2.319909
|
|
Log likelihood
|
33.49261
|
Hannan-Quinn criter.
|
-2.553576
|
|
F-statistic
|
35.78992
|
Durbin-Watson stat
|
1.833933
|
|
Prob(F-statistic)
|
0.000000
|
|
|
|
|
|
|
|
|
e) Résultat de l'estimation de
l'élasticité point de l'emploi agricole par rapport à la
valeur ajoutée du secteur agricole
EA / VAA
|
Dependent Variable: LNEA_
|
|
|
|
Method: Least Squares
|
|
|
|
Date: 05/19/13 Time: 00:04
|
|
|
|
Sample: 1 21
|
|
|
|
|
Included observations: 21
|
|
|
|
|
|
|
|
|
|
|
|
|
|
Variable
|
Coefficient
|
Std. Error
|
t-Statistic
|
Prob.
|
|
|
|
|
|
|
|
|
|
|
|
C
|
4.938878
|
1.600998
|
3.084875
|
0.0075
|
|
LNVAA
|
0.655899
|
2.195661
|
0.298725
|
0.0092
|
|
LNVAAD
|
0.628857
|
0.335590
|
1.873884
|
0.0806
|
|
D01
|
2.106844
|
1.076835
|
1.956516
|
0.0693
|
|
LNSR
|
-0.035235
|
0.059078
|
-0.596412
|
0.5598
|
|
LNOPEN
|
0.023167
|
0.089158
|
0.259841
|
0.7985
|
|
|
|
|
|
|
|
|
|
|
|
R-squared
|
0.921395
|
Mean dependent var
|
4.126029
|
|
Adjusted R-squared
|
0.895193
|
S.D. dependent var
|
0.110534
|
|
S.E. of regression
|
0.035784
|
Akaike info criterion
|
-3.587665
|
|
Sum squared resid
|
0.019208
|
Schwarz criterion
|
-3.289230
|
|
Log likelihood
|
43.67048
|
Hannan-Quinn criter.
|
-3.522897
|
|
F-statistic
|
35.16552
|
Durbin-Watson stat
|
1.921106
|
|
Prob(F-statistic)
|
0.000000
|
|
|
|
|
|
|
|
|
|
|
|
|
|
f) Résultat de l'estimation de
l'élasticité point de l'emploi industriel par rapport à
la valeur ajoutée du secteur industriel
EI / VAI
|
Dependent Variable: LNEI
|
|
|
|
Method: Least Squares
|
|
|
|
Date: 05/19/13 Time: 00:06
|
|
|
|
Sample: 1 21
|
|
|
|
|
Included observations: 21
|
|
|
|
|
|
|
|
|
|
|
|
|
|
Variable
|
Coefficient
|
Std. Error
|
t-Statistic
|
Prob.
|
|
|
|
|
|
|
|
|
|
|
|
C
|
-9.118968
|
4.782597
|
-1.906698
|
0.0759
|
|
LNVAI
|
0.219388
|
0.118306
|
1.854398
|
0.8734
|
|
LNVAID
|
0.012485
|
0.005466
|
2.284019
|
0.0374
|
|
D01
|
8.383661
|
3.650297
|
2.296706
|
0.0365
|
|
LNSR
|
0.135553
|
0.156216
|
0.867724
|
0.3992
|
|
LNOPEN
|
0.869585
|
0.253326
|
3.432666
|
0.0037
|
|
|
|
|
|
|
|
|
|
|
|
R-squared
|
0.787062
|
Mean dependent var
|
2.336080
|
|
Adjusted R-squared
|
0.716083
|
S.D. dependent var
|
0.247024
|
|
S.E. of regression
|
0.131624
|
Akaike info criterion
|
-0.982777
|
|
Sum squared resid
|
0.259873
|
Schwarz criterion
|
-0.684342
|
|
Log likelihood
|
16.31916
|
Hannan-Quinn criter.
|
-0.918009
|
|
F-statistic
|
11.08862
|
Durbin-Watson stat
|
1.903352
|
|
Prob(F-statistic)
|
0.000130
|
|
|
|
|
|
|
|
|
|
|
|
|
|
g) Résultat de l'estimation de
l'élasticité point de l'emploi dans les services par rapport
à la valeur ajoutée du secteur des services
ES / VAS
|
Dependent Variable: LNES
|
|
|
|
Method: Least Squares
|
|
|
|
Date: 05/19/13 Time: 00:08
|
|
|
|
Sample: 1 21
|
|
|
|
|
Included observations: 21
|
|
|
|
|
|
|
|
|
|
|
|
|
|
Variable
|
Coefficient
|
Std. Error
|
t-Statistic
|
Prob.
|
|
|
|
|
|
|
|
|
|
|
|
C
|
10.04692
|
5.504285
|
1.825290
|
0.0879
|
|
LNVAS
|
1.102997
|
1.664204
|
0.662777
|
0.0175
|
|
LNVASD
|
1.828762
|
1.617170
|
1.130841
|
0.2759
|
|
D01
|
6.673942
|
6.180861
|
1.079776
|
0.2973
|
|
LNSR
|
-0.143720
|
0.123752
|
-1.161352
|
0.2636
|
|
LNOPEN
|
0.278407
|
0.155945
|
1.785290
|
0.0944
|
|
|
|
|
|
|
|
|
|
|
|
R-squared
|
0.860090
|
Mean dependent var
|
3.340653
|
|
Adjusted R-squared
|
0.813453
|
S.D. dependent var
|
0.180928
|
|
S.E. of regression
|
0.078145
|
Akaike info criterion
|
-2.025551
|
|
Sum squared resid
|
0.091599
|
Schwarz criterion
|
-1.727116
|
|
Log likelihood
|
27.26828
|
Hannan-Quinn criter.
|
-1.960783
|
|
F-statistic
|
18.44234
|
Durbin-Watson stat
|
2.256499
|
|
Prob(F-statistic)
|
0.000006
|
|
|
|
|
|
|
|
|
|
|
|
|
|
| 

