4.1.3Summary of Primary Data
Results
The above presented graphs and their interpretations for the
survey of this research that was used to collect the primary data. The results
have shown that the locals of Chad perceive that the oil production and export
has led to improving the employment ratio in the country and in response
improved the financial conditions of the locals. Moreover, the results show
consensus on the idea that the oil export and production have positive impact
on the overall economy of the country. Finally, the results have also depicted
that the general consumers and locals have a strong confidence in their
government that they are efficiently regulating the income that is earned
through oil export and production.
4.2 Secondary Data
Results
4.2.1Descriptive
Analysis
Table 1 given below shows the results for descriptive analysis
that has been performed on the secondary data that was collected in this
research. Mean and median values for each variable have been given in the table
along with the minimum and maximum values for the variables. Mean is the
average for the data, median is the middle value between the minimum and
maximum values. The dispersion is shown through the value of standard
deviation. Skewness and kurtosis are values that show the normality of the
data. Results have also been presented for the Jarque-Bera test, which is a
test for judging if the data is spread normally or not. This test is based on
the difference between the skewness values and the values for kurtosis. For the
normality to hold, the probability value of Jarque-Bera should be
insignificant, i.e. above 0.05. The values in table reflect that the values for
all variables except of GGPG are insignificant ensuring that, overall, the data
is normal. Table 3: Descriptive Analysis
UER
MAG
PCIG
OER
OP
OUEP


GDPG AGG
Mean 9.864350 1.642500 2.599968 12.16734 6.075366 21.62600
122.0979 2.633871
Median 6.299993 1.550000 3.553921 10.27950 2.749628
21.25236 121.6667 1.607824
Maximum 37.33253 2.417000 16.13473 28.23261 29.12730
34.42414 177.0000 8.078003
Minimum 1.255527 1.047000 -7.641602 1.726397 -9.156966
4.080328 38.33333 0.269488
Std. Dev. 9.667054 0.448229 6.216431 9.549064 10.49218
8.797110 34.36647 2.309501
Skewness 1.804077 0.348988 0.175773 0.412567 1.222962
-0.360360 -0.617386 0.804017
Kurtosis 5.308339 1.658841 2.365637 1.634602 3.700286
2.226888 3.195224 2.516137
Jarque-Bera 16.818272.095388 0.482167 2.333061 5.933537
1.024044 1.432545 2.584907
Probability 0.000223 0.350746 0.785776 0.311446 0.051469
0.599283 0.488570 0.274596
Sum 217.0157 36.13500 57.19930 267.6816 133.6581 475.7720
2686.154 57.94515
Sum Sq.
Dev. 1962.491 4.219098811.5243 1914.877 2311.801 1625.172
24802.14 112.0097
Observation
s 22 22 22 22 22 22 22 22

4.2.2Correlation
Analysis
Correlation analysis is a statistical method which can be used
to test how strongly two variables are related to each other. Correlation
analysis results show the strength of relationship between two quantitative
variables. If two variables are highly correlated then it means that they have
a strong relationship with each other, while weakly correlated variables are
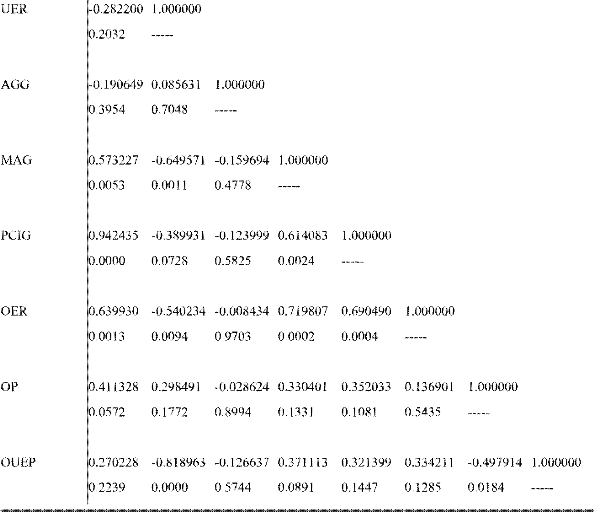
those that are hardly related to one another. The table 2 given below shows the
results of correlation analysis of the variables of this study. The results are
shown in two values, the value written above is the value for correlation and
the four digit values given below them show the probability values of each
relation. GDP has insignificant relationship with UER, OUEP and AGG, while its
correlation with all others is significant. UER has insignificant correlation
with AGG and OP, while having a significant correlation with all other
variables. AGG is insignificantly correlated to all the variables of this
study, showing that it is highly self-correlated. MAG has significant
correlations with all but OP, PCIG is insignificantly correlated to the control
variables and significant with the independent and all other dependents except
AGG. As for OER, the independent variable of this study, it is insignificantly
related to the control variables and AGG but significant with all others. OP is
significant only for correlation with OUEP and OUEP is significant only for UER
and OP.
Table 4: Correlation Analysis

Correlation
|
Probability
|
GDPG UER
|
AGG
|
MAG
|
PCIG
|
OER
|
OP
|
OUEP
|
|
GDPG
|
1.000000
-----
|
|
|
|
|
|
|

| 


