Annexe 1 : Résultats d'estimation du
modèle
Dependent Variable: LOG(PIBT) Method: Least Squares Date:
11/18/13 Time: 09:15 Sample: 1981 2010
Included observations: 30

ii
|
Variable
|
Coefficient
|
Std. Error t-Statistic
|
Prob.
|
|
C
|
2.84E-09
|
1.64E-10 17.31587
|
0.0000
|
|
LOG(PIBT-1)
|
1.000000
|
1.03E-11 9.69E+10
|
0.0000
|
|
LOG(MASMON)
|
-1.42E-12
|
1.37E-12 -1.037137
|
0.3109
|
|
LOG(RESERV)
|
3.63E-13
|
2.28E-12 0.158984
|
0.8751
|
|
LOG(CREDOM)
|
-1.99E-12
|
1.87E-12 -1.065039
|
0.2984
|
|
LOG(EXPORT)
|
7.25E-13
|
3.91E-12 0.185471
|
0.8546
|
|
LOG(TAUDINTER)
|
4.43E-12
|
2.32E-12 1.909173
|
0.0694
|
|
LOG(INVPRIV)
|
-5.50E-12
|
2.96E-12 -1.854203
|
0.0772
|
|
R-squared
|
1.000000
|
Mean dependent var
|
22.77860
|
|
Adjusted R-squared
|
1.000000
|
S.D. dependent var
|
0.322706
|
|
S.E. of regression
|
7.03E-12
|
Akaike info criterion
|
-48.30043
|
|
Sum squared resid
|
1.09E-21
|
Schwarz criterion
|
-47.92677
|
|
Log likelihood
|
732.5064
|
F-statistic
|
8.73E+21
|
|
Durbin-Watson stat
|
0.891198
|
Prob(F-statistic)
|
0.000000
|
10
8
6
4
2
0
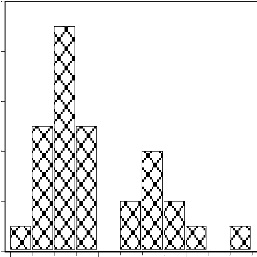
Annexe 2 Test de normalité des erreurs
Series: Residuals
Sample 1981 2010
Observations 30
Mean 1.30E-14
Median -2.50E-12
Maximum 1.68E-11
Minimum -8.21E-12
Std. Dev. 6.12E-12
Skewness 0.919379
Kurtosis 3.057589
Jarque-Bera 4.230436
Probability 0.120607

iii
-10E-11 -81E-28 10E-11
Annexe 3 : Breusch-Godfrey Serial Correlation LM
Test:
F-statistic 1.706831 Probability 0.181977
Obs*R-squared 13.30098 Probability 0.065106
Test Equation:
Dependent Variable: RESID Method: Least Squares
Std. Error t-Statistic Prob.
1.82E-10 0.729937 0.4767
1.10E-11 -0.866757 0.3997
1.33E-12 -0.371644 0.7154
2.16E-12 -0.703121 0.4927
2.07E-12 1.086670 0.2943
4.28E-12 0.303197 0.7659
2.84E-12 -0.232569 0.8192
3.06E-12 0.883622 0.3908
0.264004 2.987751 0.0092
0.330640 -1.211336 0.2445
0.412063 0.436701 0.6685
0.362177 -0.435232 0.6696
0.347351 -0.418201 0.6817
0.327448 -0.485063 0.6346
0.346184 -0.153287 0.8802
Mean dependent var 1.30E-14
S.D. dependent var 6.12E-12
Akaike info criterion -48.41961
Schwarz criterion -47.71901
F-statistic 0.853406
Prob(F-statistic) 0.614077
Date: 02/07/14 Time: 17:31
|
|
Variable
|
Coefficient
|
|
C
|
1.33E-10
|
|
LOG(PIBT-1)
|
-9.54E-12
|
|
LOG(MASMON)
|
-4.95E-13
|
|
LOG(RESERV)
|
-1.52E-12
|
|
LOG(CREDOM)
|
2.25E-12
|
|
LOG(EXPORT)
|
1.30E-12
|
|
LOG(TAUDINTER)
|
-6.61E-13
|
|
LOG(INVPRIV)
|
2.70E-12
|
|
RESID(-1)
|
0.788780
|
|
RESID(-2)
|
-0.400516
|
|
RESID(-3)
|
0.179948
|
|
RESID(-4)
|
-0.157631
|
|
RESID(-5)
|
-0.145263
|
|
RESID(-6)
|
-0.158833
|
|
RESID(-7)
|
-0.053065
|
|
R-squared
|
0.443366
|
|
Adjusted R-squared
|
-0.076159
|
|
S.E. of regression
|
6.35E-12
|
|
Sum squared resid
|
6.05E-22
|
|
Log likelihood
|
741.2942
|
|
Durbin-Watson stat
|
1.590158
|

iv

V
Annexe 4 : Equation à court terme
Dependent Variable: D(LOG(PIBT))
Method: Least Squares
Date: 12/02/15 Time: 09:16
Sample(adjusted): 1982 2010
Included observations: 29 after adjusting endpoints
|
Variable
|
Coefficien
t
|
Std. Error t-Statistic
|
Prob.
|
|
C
|
2.758128
|
2.625610 1.050471
|
0.3054
|
|
D(LOG(MASMON))
|
0.013941
|
0.028807 0.483953
|
0.6334
|
|
D(LOG(RESERV))
|
-0.051714
|
0.052362 -0.987614
|
0.3346
|
|
D(LOG(CREDOM))
|
0.062874
|
0.041733 1.506592
|
0.1468
|
|
D(LOG(EXPORT))
|
0.174837
|
0.129821 1.346758
|
0.1924
|
|
D(LOG(TAUDINTER))
|
-0.047345
|
0.049824 -0.950240
|
0.3528
|
|
D(LOG(INVPRIV))
|
-0.029064
|
0.073272 -0.396655
|
0.6956
|
|
LOG(PIBT(-1))
|
-0.121133
|
0.115450 -1.049224
|
0.0160
|
|
R-squared
|
0.867607
|
Mean dependent var
|
0.001533
|
|
Adjusted R-squared
|
0.856809
|
S.D. dependent var
|
0.182290
|
|
S.E. of regression
|
0.167389
|
Akaike info criterion
|
-0.508045
|
|
Sum squared resid
|
0.588399
|
Schwarz criterion
|
-0.130860
|
|
Log likelihood
|
15.36665
|
F-statistic
|
1.743882
|
|
Durbin-Watson stat
|
1.859080
|
Prob(F-statistic)
|
0.152799
|
| 

