III.2. ANALYSE DES DONNÉES
III.2.1. TABLEAUX DES RESULTATS DES ECHANTILLAGES
- Résultats issus du questionnaire
adressé aux parents des enfants bénéficiaires des
prestations du CPISB
1- Domaine d'activité
|
Modalités
|
Artisanat
|
Commerce
|
Enseignement
|
Conducteur
|
|
Effectifs
|
06
|
11
|
02
|
02
|
|
Pourcentage%
|
24
|
44
|
08
|
08
|
|
Modalités
|
Informatique
|
Coiffure
|
Journalisme
|
Doctorant
|
|
Effectifs
|
01
|
01
|
01
|
01
|
|
Pourcentage%
|
04
|
04
|
04
|
04
|
TABLEAU n°03 : Répartition par
secteurs d'activités Source : Réalisation personnelle,
mai 2017
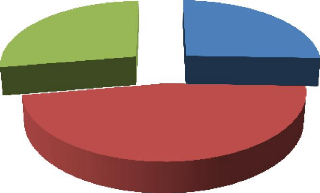
Autres
28%
Commerce
47%
Artisanat
25%
26
Graphique n°1: Secteur d'activité
27
2- Comment avez-vous connu le centre ?
|
Modalités
|
Intermédiaire
|
ONG
|
Radio-
Télé
|
Autres
(Internet)
|
Total
|
|
Effectifs
|
20
|
03
|
01
|
01
|
25
|
|
Pourcentage%
|
80
|
12
|
04
|
04
|
100
|
TABLEAU n°04 : Répartition des
sources d'information Source : Réalisation personnelle, mai
2017
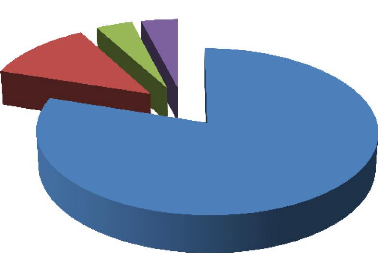
Par Radio-TV
4%
Autres
4%
Par ONG
12%
Par Intermédiaire
80%
Graphique n°2: Sources d'informations
28
3- Connaissez-vous d'autres centres similaires ?
|
Modalités
|
OUI
|
NON
|
Total
|
|
Effectifs
|
09
|
15
|
24
|
|
Pourcentage %
|
37.5
|
62.5
|
100
|
TABLEAU n°05 : Connaissance sur autres
centres similaires Source : Réalisation personnelle, mai
2017
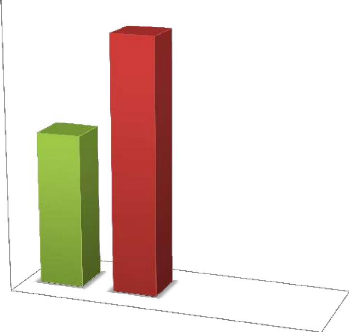
50,00%
40,00%
30,00%
20,00%
10,00%
0,00%
OUI
70,00%
60,00%
37,50%
62,50%
NON
Graphique n°3: Connaissance d'existence des
autres
centres
29
4- Pourquoi avoir choisi ce centre pour l'éducation de
votre enfant ?
|
Modalités
|
Par
obligation
|
Pour
l'entraide
|
Pour son bien-être
|
Autres (Distance)
|
Total
|
|
Effectifs
|
00
|
02
|
21
|
01
|
24
|
|
Pourcentage%
|
00
|
08
|
88
|
04
|
100
|
TABLEAU n°06 : Justification des choix
opérés par les parents Source : Réalisation
personnelle, mai 2017
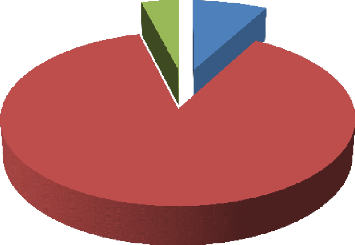
Bien être
88%
Autres
4%
Entraide
8%
Graphique n°4: La justification du choix
30
5- Arrivez-vous à payer la scolarité de votre
enfant ?
|
Modalités
|
OUI
|
NON
|
Total
|
|
Effectifs
|
16
|
08
|
24
|
|
Pourcentage %
|
67
|
33
|
100
|
TABLEAU n°07 : Payement effectif des droits
de scolarité Source : Réalisation personnelle, mai
2017
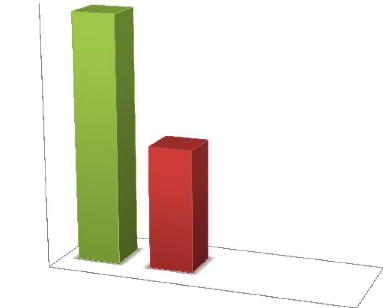
70,00%
60,00%
50,00%
40,00%
67,00%
30,00%
20,00%
33,00%
10,00%
0,00%
OUI
NON
Graphique n°5: Payement des droits
d'écolage
31
6- Arrivez-vous à communiquer avec votre enfant ?
|
Modalités
|
OUI
|
NON
|
Total
|
|
Effectifs
|
16
|
08
|
24
|
|
Pourcentage %
|
67
|
33
|
100
|
TABLEAU n°08 : Répartition selon
moyen de communication Source : Réalisation personnelle, mai
2017
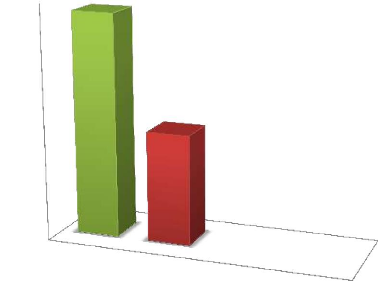
70,00%
60,00%
50,00%
40,00%
67,00%
30,00%
20,00%
33,00%
10,00%
0,00%
OUI
NON
Graphique n°6: Moyens de communication
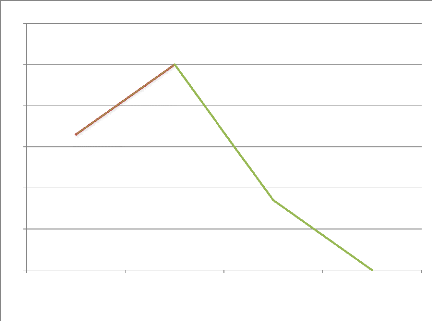
40
60
50
30
20
10
0
PASSABLE BIEN TRES BIEN
Graphique n°7: L'évolution des
enfants
32
7- Comment évolue la connaissance de votre enfant depuis
qu'il fréquente ce centre ?
|
Modalités
|
Bien
|
Très bien
|
Passable
|
Médiocre
|
Total
|
|
Effectifs
|
12
|
04
|
08
|
00
|
24
|
|
Pourcentage %
|
50
|
17
|
33
|
00
|
100
|
TABLEAU n°09 : Répartition selon le
niveau d'évolution des apprenants Source : Réalisation
personnelle, mai 2017
8- 33
Les prestations du centre vous satisfont-elles ?
Modalités
|
OUI
|
NON
|
Total
|
Effectifs
|
20
|
04
|
24
|
Pourcentage%
|
83
|
17
|
100
|
|
TABLEAU n°10 : Répartition selon le
degré de satisfaction Source : Réalisation
personnelle, mai 2017
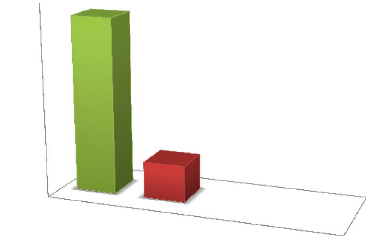
90,00%
80,00%
70,00%
60,00%
50,00%
17,00%
83,00%
OUI
NON
40,00%
30,00%
20,00%
10,00%
0,00%
Graphique n°8: Le niveau de satisfaction
9- Notez le centre sur une échelle de 0 à 10
|
Modalités
|
05
|
06
|
07
|
08
|
09
|
Rien
|
Total
|
|
Effectifs
|
01
|
04
|
07
|
06
|
01
|
05
|
24
|
|
Pourcentage %
|
04
|
14
|
29
|
25
|
04
|
21
|
100
|
TABLEAU n°11 : Répartition des notes
d'appréciation
34
| 


