4.2. Age and growth performances for investigated
species
4.2.1. Age, ring increment and cross-dating
The results of the cross dating process are summarized in
table 3 and show ed a great difference between the species depending of the
genetics characteristics and the growth conditions of the a tree.
TABLE 3 - Age and MRI of the investigated
species. MRI= Mean Ring Increment values. SNK = Student - Newman - Keuls
grouping of the species according to age and MRI (logarithmic transformation
was applied before the ANOVA test). Values with the same letter are not
significantly different. m= mean; s= standard deviation and do: error margin
for 95% of probability.
|
Species
|
Age (years)
|
MRI (mm)
|
|
m
|
s
|
do
|
SNK
grouping
|
m
|
s
|
do
|
SNK
grouping
|
|
D. abyssinica
|
30.25
|
2.55
|
1.77
|
A
|
1.19
|
0.22
|
0,15
|
D
|
|
A. leiocarpa (CNP)
|
17.00
|
1.41
|
0.98
|
B
|
1.90
|
0.61
|
0,42
|
C
|
|
D. microcarpum
|
13.40
|
2.12
|
1.31
|
C
|
2.02
|
0.31
|
0,19
|
C
|
|
P. erinaceus
|
8.20
|
1.09
|
0.95
|
D
|
2.32
|
0.29
|
0,25
|
C
|
|
I. doka
|
7.83
|
2.40
|
1.92
|
D
|
2.83
|
0.48
|
0,38
|
B
|
|
A. leiocarpa (UAC)
|
6.33
|
0.82
|
0.66
|
E
|
3.37
|
0.52
|
0,42
|
A
|
The youngest sampled species was A. leiocarpa from
UAC followed by the group of I. doka and P. erinaceus and the
oldest was D. abyssinica. The annual radial growth is great for young
trees and low for the oldest. These findings proved that the age and the mean
annual ring increment varied from one species to another, between trees and
also from one stand to another. According to these results, A. leiocarpa
trees from UAC, the youngest trees, showed the best mean annual radial
growth that was twice more than those of CNP. In fact, the targeted trees of
UAC (Benin) were between 5 to 7 years old and all had 1.8 m of height. The
diameters at 10 cm from ground vary between 4 cm and 5 cm. Those of CNP were 16
to 19 years old in 2001. Their height varied between 5.6 m to 7.1 m and the
diameters varied between 6.5 and 7.5 cm. D. abyssinica, the oldest
investigated trees showed the lowest radial growth witch is a characteristic of
the species. This variation of annual growth within the same tree is observed
in figure 10.
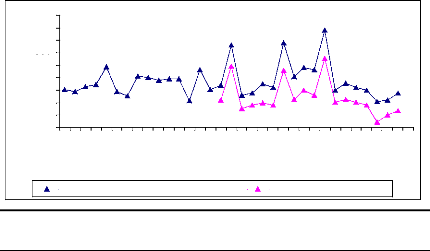
Figure 10: Cross-dating ring width of D.
abyssinica oldest sampled tree cut at two different
heights. The yellow
curve was obtained from sample cut at 10 cm from ground and the ot her one was
for sample cut at 1.3 m from ground. Axe X describes the year and axe Y
presents the widths of rings
450
Time (Year)
1969
1979
1981
1997
1989
1977
1991
1971
1999
1995
1993
1987
1985
1983
1975
1973
2001
Rings width (1/100 m
400
350
300
250
200
150
100
50
0
Stem disc cutted at 10 cm from ground Stem disc cutted at DBH
The information about the lifetime of the oldest sampled tree
is present in figure 2. This figure was obtained using microscopic, TSAPWin
software in combination with lintab. The raw ri ng widths were cross-dated.
This curve shows the variation in annual ring increment from one year to
another. The tree germinated in 1969 and formed its first ring in 1970. The
highest ring width was observed in 1982 and the lowest was noticed in 1973 that
would probably be due to rainfall effect on tree growth in tropical area. T he
tree reached the height of 1.3 m in 1984 and proved the low growth rate of
D. abyssinica trees. The cross-dating index (CDI) is 23.5 (CDI >
10). This shows that the test of cros s-dating is very significant with the
probability of 99 %. The t-value (25.1) is greater than 3 and demonstrates the
high similarity between the two curves. Then, the statistic test proved a
similar radi al rate growth from ground to 1.3 m in D. abyssinica
trees. The same remark was made for D. microcarpum
trees.
Time (Year)
500
Rings width (1/100 nn,
450
400
350
300
250
200
150
100
50
0
Stem disc cutted at 10 cm from ground Stem disc cutted at DBH
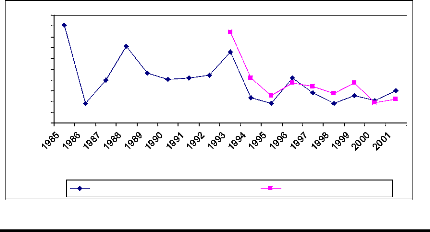
Figure 11: Cross-dating ring width of
Detarium microcarpum oldest sampled tree cut at two
different
heights. The yellow curve was obtained from sample cut at 10 cm from ground and
the white curve was for sample cut at 1,3 m from ground. X describes the year
and axe Y presents the widths of rings
The oldest sample tree of D. microcarpum germinated
in 1984. It reached the DBH after eight years of life. The greater ring
increment was observed during the first year. The cross-dating test is
significant. The similarity between the two curves is also high.
4 5 0
4 0 0
3 5 0
3 0 0
2 5 0
2 0 0
1 5 0
1 0 0
5 0
0
Rings width (1/1( r,
1985
1986
1987
1988
1989
1990
1991
1992
1993
1994
1995
1996
1997
1998
1999
2000
2001
Time (Year)
Stem disc c u tte d a t 1 0 c m from ground Stem disc c u tte d a
t D B H
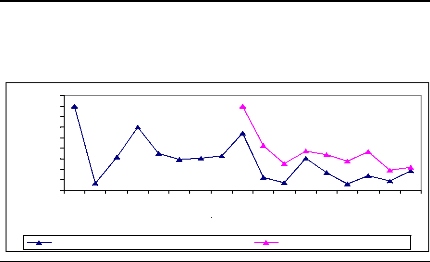
Figure 12: Cross-dating ring width of one of
sampled tree of A. leiocarpa cut at two different
heights. The yellow curve was obtained from sample cut at 10 cm
from ground and the white curve was for sample cutted at 1.3 m of height. X
describes the year and Y presents the width of the rings.
This tree produced its first ring in 1985. It reached the height
of 1.3 m in 1992. The cross - dating index is significant and the similarity
between the two curves is high.
| 

