BIBLIOGRAPHIE
· Asif Agha and Muhammad Khan (2006), «An Empirical
Analysis of Fiscal Imbalances and Inflation in Pakistan», SBP Research
Bulletin, Vol. 2, No. 2, pp 343- 362.
· Ball, L. and Mankiw G. (1995), «Relative Price
Changes as Aggregate Supply Shocks,» Quarterly Journal of
Economics, pp: 161-194, February 1995.
· Bruno M. and Fischer S. (1990), «Seignorage,
Operating Rules and the High Inflation Trap,» Quarterly Journal of
Economies, y. 105 (May), pp: 353-74.
· Campillo et al. (1996), «Why Does inflation Differ
Across Countries?», NBER Working Paper, N° 5540, April
1996.
· Chopra A. (1985), «The Speed of Adjustment of the
Inflation Rate in Developing Countries: A Study of Inertia.» IMF Staff
Papers, Vol. 32, No. 4 (December), pp: 693-733.
· Coe, David T. and McDermott J. (1997), «Does the Gap
Model Work in Asia?» IMF Staff Papers, Vol. 44 No. 1, March
1997.
· Gali J. and Gertler M. (1999), «Inflation Dynamics:
A Structural Econometric Analysis,» Journal of Monetary
Economics, y. 44 (October), pp: 195-222.
· Généreux J. (2001), Introduction
à l'économie, Collection Points Économie,
Édition du seuil, 1992, nouvelle édition, 2001, Points E31, pp:
153-157.
· J. Gali et al. (1994), «Sources of Real Exchange
rate Fluctuations: How Important are Nominal Shocks?» NBER Working
Paper, N° 4658, February 1994.
· Kivilcim M. et al. , «Dynamics of Inflation and
Inflation Inertia in Turkey», Bilkent University, Department of
Economics 06533 Ankara.
· Liviatan N. and Piterman S. (1986), «Accelerating
Inflation and Balance of Payments Crises, 1973--1984,» in The Israeli
Economy, ed. By Yoram Ben-Porath (Cambridge: Harvard University Press),
pp. 320-46.
· Loungani P. and Swagel P. (1996), «Supply-Side
Sources of Inflation: Evidence from OECD Countries,» international
Finance Discussion Paper no. 515, Federal Reserve Board, October.
· Lubrano, M. (2006), « Modélisation
Multivariée et cointégration » Université de
Paris Panthéon, Octobre 2006.
· Mialou, A. (2002), « L'inflation sous-jacente en
Afrique du sud et au Gabon : Une modélisation à partir de
l'approche VAR structurelle », Note d'Etude et de Recherche N° 1
, BEAC, octobre 2002.
· Montiel P. 1989, «Empirical Analysis of
High-Inflation Episodes in Argentina, Brazd and Israel,» IMF Staff
Papers, Vol. 36, No. 3 (September), pp: 527- 549.
· Moser, Gary G. (1995), «The Main Determinants of
Inflation in Nigeria,» IMF Staff Papers, Vol. 42, No.2 (June),
pp: 270-289.
· Razin A. and Sadka E. (1987), Economic Policy in
Theory and Practice. New York: St. Martin's Press.
· Tavera, C. (2003), « Modélisation
VAR », Université de Rennes, septembre 2003.
· Watson, T. (1994), vector autoregression and
cointegration , in Handbook of Economics, Ed, by R Engle and D. Mc
FADDEN,vol. IV,Chap 47, Elsevier, new York, PP 2843-2915.
ANNEXES
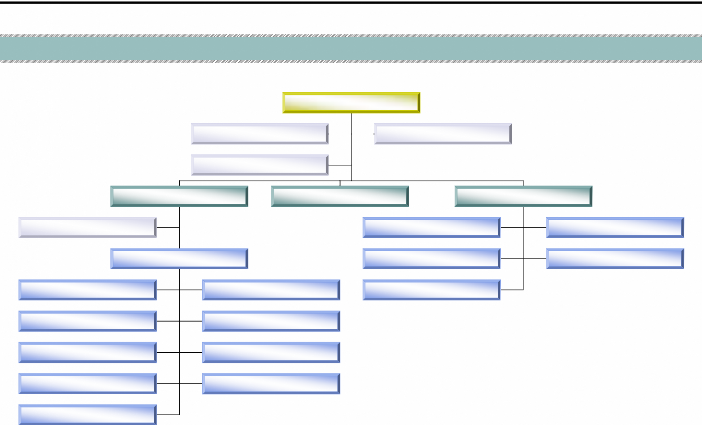
Figure 9 : (Annexe 1) Organigramme de la BEAC Direction
Nationale du Cameroun
DIRECTEUR NATIONAL
Conseil National Du Crédit
Conseil du Directeur National
Secrétaires
Directeurs Adjoints (02)
Responsable Informatique
Agences
Secrétaires
Bafoussam
Douala
Services
Garoua
Limbé
Personnel
Balance des Paiements
Nkongsamba
Gestion
Crédits et Centrale des risques
Émission monétaire
Marché monétaire
Études et Recherche
Comptabilité
Réglementation bancaire
Source : BEAC-DN


Secrétaire
Chef de service
Responsable
Documentation
Assistants Comptables
Comptable
Chef de Division
Chef de section
Principal
Figure 10 : (Annexe2) Organigramme du service des
Études

- 7.183385
0.0000
Test critical values:
1% level
- 3.577723
- 3.577723
5% level
- 2.925169
5% level
- 2.925169
10% level
- 2.600658
10% level
- 2.600658
2.841923
-3.513146
Augmented Dickey-Fuller test statistic
Augmented Dickey-Fuller Test Equation
*MacKinnon (1996) one-sided p-values.
Adjusted R-squared 0.523815 S.D. dependent var 1.422174
Durbin-Watson stat 1.749160 Prob(F-statistic) 0.000000
Sum squared resid 43.34050 Schwarz criterion 2.920653
S.E. of regression 0.981388
Lag Length: 0 (Automatic based on SIC, MAXLAG=9)
Log likelihood -64.78520 F-statistic 51.60102
Included observations: 47 after adjusting endpoints
R-squared 0.534166 Mean dependent var 0.015621
INFL(-1) -1.024317 0.142595 -7.183385 0.0000
Variable Coefficient Std. Error t-Statistic Prob.
Sample(adjusted): 1995:2 2006:4
Dependent Variable: D(INFL)
Date: 05/20/08 Time: 10:06
C 0.692234 0.171359 4.039666 0.0002
Null Hypothesis: INFL has a unit root
Method: Least Squares
Exogenous: Constant
Akaike info criterion
t-Statistic Prob.*
Adjusted R-squared 0.412718 S.D. dependent var 0.053387
Durbin-Watson stat 1.947784 Prob(F-statistic) 0.000001
Test critical values: 1% level
Sum squared resid 0.075322 Schwarz criterion -3.434416
M2GROWTH(-1) -0.852686 0.147704 -5.772953 0.0000
S.E. of regression 0.040912
Log likelihood 84.55893 F-statistic 33.32698
Lag Length: 0 (Automatic based on SIC, MAXLAG=9)
Augmented Dickey-Fuller Test Equation
*MacKinnon (1996) one-sided p-values.
Dependent Variable: D(M2GROWTH)
Augmented Dickey-Fuller test statistic -5.772953
0.0000
R-squared 0.425485 Mean dependent var 0.000897
Included observations: 47 after adjusting endpoints
Variable Coefficient Std. Error t-Statistic Prob.
Null Hypothesis: M2GROWTH has a unit root
Sample(adjusted): 1995:2 2006:4
C 0.015817 0.006503 2.432186 0.0190
Date: 05/20/08 Time: 10:19
Method: Least Squares
Exogenous: Constant
Akaike info criterion
t-Statistic Prob.*
Tableau 3 : (Annexe3) Résultats du test de racine
unitaire des variables du modèle
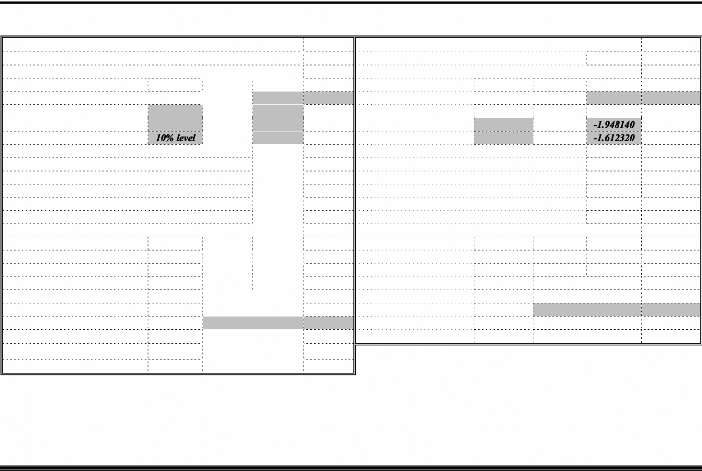
Null Hypothesis: NONPETROL has a unit root
Null Hypothesis: OUTPUTGAP has a unit root
Exogenous: Constant
Exogenous: None
Lag Length: 1 (Automatic based on SIC, MAXLAG=9)
Lag Length: 1 (Automatic based on SIC, MAXLAG=9)
t-Statistic Prob.*
t-Statistic Prob.*
- 5.741092
0.0000
Augmented Dickey-Fuller test statistic
Augmented Dickey-Fuller test statistic -2.517426
0.0129
- 3.581152
Test critical values: 1% level
Test critical values: 1% level -2.616203
5% level
- 2.926622
5% level
- 2.601424
10% level
*MacKinnon (1996) one-sided p-values.
*MacKinnon (1996) one-sided p-values.
Augmented Dickey-Fuller Test Equation
Augmented Dickey-Fuller Test Equation
Dependent Variable: D(NONPETROL)
Dependent Variable: D(OUTPUTGAP)
Method: Least Squares
Method: Least Squares
Date: 05/20/08 Time: 10:25
Date: 05/20/08 Time: 10:30
Sample(adjusted): 1995:3 2006:4
Sample(adjusted): 1995:3 2006:4
Included observations: 46 after adjusting endpoints
Included observations: 46 after adjusting endpoints
Variable Coefficient Std. Error t-Statistic Prob.
Variable Coefficient Std. Error t-Statistic Prob.
NONPETROL(-1) -1.260684 0.219590 -5.741092 0.0000
OUTPUTGAP(-1) -0.133450 0.053010 -2.517426 0.0155
D(NONPETROL(-1)) 0.181513 0.152428 1.190813 0.2403
C 0.006943 0.002133 3.254961 0.0022
D(OUTPUTGAP(-1))
R-squared 0.472800 Mean dependent var -0.000835
0.597968 0.099975 5.981199 0.0000
R-squared 0.549411 Mean dependent var -0.000431
Adjusted R-squared 0.460818 S.D. dependent var 0.005950
Adjusted R-squared 0.528453 S.D. dependent var 0.017079
-7.985967
S.E. of regression 0.004369
Akaike info criterion
Sum squared resid 0.000840 Schwarz criterion -7.906461
S.E. of regression 0.011728
Akaike info criterion -5.990720
Log likelihood 185.6772 Durbin-Watson stat 2.132524
Sum squared resid 0.005914 Schwarz criterion -5.871461
Log likelihood 140.7866 F-statistic 26.21531
Durbin-Watson stat 1.948859 Prob(F-statistic) 0.000000

Augmented Dickey-Fuller test
statistic
Adjusted R-squared 0.525366 S.D. dependent var 0.095545
Test critical values:
Sum squared resid 0.199313 Schwarz criterion -2.543230
S.E. of regression 0.065825
Lag Length: 0 (Automatic based on SIC, MAXLAG=9)
Log likelihood 61.69098 Durbin-Watson stat 2.009927
Augmented Dickey-Fuller Test Equation
*MacKinnon (1996) one-sided p-values.
PETROL(-1) -1.054473 0.147766 -7.136109 0.0000
Included observations: 47 after adjusting endpoints
R-squared 0.525366 Mean dependent var 0.000813
Method: Least Squares
Variable Coefficient Std. Error t-Statistic Prob.
Dependent Variable: D(PETROL)
Sample(adjusted): 1995:2 2006:4
Null Hypothesis: PETROL has a unit root
Date: 05/20/08 Time: 10:35
Exogenous: None
10% level
1% level
5% level
Akaike info criterion
- 7.136109
- 2.615093
- 1.947975
- 1.612408
t-Statistic Prob.*
-2.582595
0.0000
Dependent Variable: D(TXCHANGGROWTH)
TXCHANGGROWTH(-1) -1.045582 0.147326 -7.097070 0.0000
Adjusted R-squared 0.522663 S.D. dependent var 0.071654
Test critical values:
Sample(adjusted): 1995:2 2006:4
Sum squared resid 0.112735 Schwarz criterion -3.113069
S.E. of regression 0.049505
Null Hypothesis: TXCHANGGROWTH has a unit
root
Log likelihood 75.08219 Durbin-Watson stat 1.925654
Date: 05/20/08 Time: 10:38
Lag Length: 0 (Automatic based on SIC, MAXLAG=9)
Augmented Dickey-Fuller Test Equation
*MacKinnon (1996) one-sided p-values.
Augmented Dickey-Fuller test statistic
R-squared 0.522663 Mean dependent var 0.000161
Included observations: 47 after adjusting endpoints
Variable Coefficient Std. Error t-Statistic Prob.
Method: Least Squares
Exogenous: None
10% level
1% level
5% level
Akaike info criterion
- 7.097070
- 2.615093
- 1.947975
- 1.612408
t-Statistic Prob.*
-3.152433
0.0000
Source : Résultats
d'estimations.

Structural VAR Estimates
Date: 05/19/08 Time: 09:04
Sample(adjusted): 1996:1 2006:4
Included observations: 44
after adjusting endpoints
Estimation method: method of scoring (analytic
derivatives)
Convergence achieved after 9 iterations
Structural VAR is
just-identified
Model: Ae = Bu where E[uu']=I Restriction Type: short-run pattern
matrix Log likelihood 498.8528
A=
1,00000 0,00000 0,00000 0,00000 0,00000 0,00000
0,00000 1,00000 0,00000 0,00000 0,00000 0,00000
0,00000 0,00000 1,00000 0,00000 0,00000 0,00000
0,00000 0,00000 0,00000 1,00000 0,00000 0,00000
0,00000 0,00000 0,00000 0,00000 1,00000 0,00000
0,00000 0,00000 0,00000 0,00000 0,00000
1,00000
Estimated B
matrix:
0.048936 0.000000 0.000000 0.000000 0.000000
0.000000
-0.000523 0.010361 0.000000 0.000000 0.000000
0.000000
0.000448 0.003520 0.003656 0.000000 0.000000
0.000000
-0.005018 0.002078 0.001885 0.039843 0.000000
0.000000
0.003045 -0.005381 0.000189 -0.003900 0.040146
0.000000
0.255808 -0.053484 -0.275423 0.012341 -0.046329
0.806619
Tableau 4 : (Annexe4) Résumé de
l'estimation des paramètres structurels du modèle
1996 1998 2000 2002 2004 2006
|
.05
.04
.03
.02
.01
.00
-.01
-.02
|
|
1996 1998 2000 2002 2004 2006
|
.12
.08
.04
.00
-.04
-.08
-.12
|
|
|
1996 1998 2000 2002 2004 2006
|
|
.05
.04
.03 .02 .01 .00
-.01
-.02
|
|
1996 1998 2000 2002 2004 2006
|
.10
.05
.00
-.05 -.10 -.15 -.20
|
|
1996 1998 2000 2002 2004 2006
|
4 3 2 1 0
-1
-2
-3
|
|
|
1996 1998 2000 2002 2004 2006
|
|
INFL
|

OUTPUTGAP

TXCHANGGROWTH

M2GROWTH
Figure 11 : (Annexe5) Graphique des variables du
modèle
PETROL
NONPETROL
Figure 12 : (Annexe6) Graphique des Résidus des
estimations
PETROL Residuals
|
.08 .06 .04 .02 .00 -.02 -.04 -.06 -.08
|
|
1996 1998 2000 2002 2004 2006
OUTPUTGAP Residuals
|
.016 .012 .008 .004 .000 -.004 -.008
|
|
1996 1998 2000 2002 2004 2006
TXCHANGGROWTH Residuals
|
.08 .04 .00 -.04 -.08 -.12
|
|
1996 1998 2000 2002 2004 2006 NON PETROL Residuals
1996 1998 2000 2002 2004 2006
M2GROWTH Residuals
|
.06
.04
.02 .00 -.02 -.04 -.06
|
|
1996 1998 2000 2002 2004 2006
IN FL Residuals
|
1.5 1.0 0.5 0.0 -0.5 -1.0 -1.5
|
|
1996 1998 2000 2002 2004 2006
Tableau 5 : (Annexe7) Réponse de l'inflation
à une variation de 1% de chaque variable
|
|
Impulse Response Table
|
|
|
Period PETROL
|
NONPETROL
|
OUTPUTGAP
|
M2GROWTH
|
TXCHANGGROWTH
|
|
1
|
0.255808
|
-0.053484
|
-0.275424
|
0.012341
|
-0.046325
|
|
2
|
0.004686
|
0.118743
|
0.369541
|
-0.140682
|
0.092228
|
|
3
|
0.147507
|
0.253399
|
0.292468
|
-0.146287
|
0.135104
|
|
4
|
-0.223843
|
-0.115752
|
-0.251840
|
0.062269
|
0.259041
|
|
5
|
-0.149545
|
-0.143365
|
-0.262976
|
0.042488
|
-0.011448
|
|
6
|
0.108228
|
0.195199
|
0.101903
|
-0.004511
|
-0.053452
|
|
7
|
0.186234
|
0.267913
|
0.141652
|
-0.291685
|
0.030627
|
|
8
|
0.056304
|
0.113017
|
0.078607
|
-0.165825
|
-0.003740
|
|
9
|
-0.057228
|
0.163590
|
0.243139
|
-0.010004
|
0.037966
|
|
10
|
-0.071406
|
0.073758
|
0.142686
|
0.066036
|
0.163056
|
|
11
|
-0.044113
|
0.036424
|
-0.036474
|
0.055463
|
0.064987
|
|
12
|
-0.020237
|
0.005973
|
-0.078587
|
0.014257
|
-0.034000
|
|
Cholesky Ordering: PETROL NONPETROL OUTPUTGAP M2GROWTH
TXCHANGGROWTH
|
|
INFL
|
Le cas du Cam eroun de 1995 à 2006
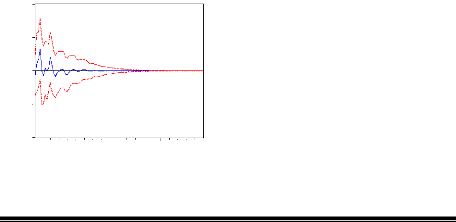
Figure 13 : (Annexe8) Graphique des fonctions de
réponse de l'inflation aux divers choc
Response to Structural One S.D. Innovations #177; 2 S.E.
.8
.4
.0
-.4
-.8
.8
.4
.0
-.4
-.8
Response of INFL to PETROL Shock
25 50 75 100
Response of INFL to OUTPUTGAP Shock
25 50 75 100
Response of INFL to NONPETROL Shock
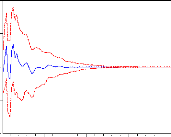
25 50 75 100
Response of INFL to M2GROWTH Shock
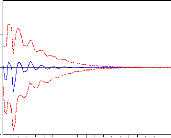
25 50 75 100
.8
.4
.0
-.4
-.8
25 50 75 100
Response of INFL to TXCHANGROWTH Shock
| 


