1 Significance of the Research
«Risk is like love; we all know what it is, but we don't
know how to define it»
J. STIGLITZ
According to Allen, Myers & Brealey (2008, pp. 966-967)
the capital asset pricing model (CAPM) and the Net Present Value (NPV) are ones
of the most important concepts in finance. The CAPM allows investors to
identify the non-diversifiable risks, by measuring the impact of a change in
the aggregate value of the overall economy on the value of their investments.
The NPV on the other side helps managers to choose between different projects,
or even to choose to kill or not a project. The CAPM relies on the calculation
of betas, and NPV relies on the choice of the discount factor. However, there
are many ways to evaluate this discount factor. First, when a manager has many
options or projects, he can set the discount factor at the opportunity cost of
capital which is the profitability of the best project to evaluate each
project. But this method does not take into account the risk associated with
each projects and is not helpful when a manager has only one project, or when
he just wants to evaluate the economic profitability of its company at a fair
market price. In the last case, the appropriate way to set the discount factor
is the CAPM and the calculation of the Weighted Average Cost of Capital (WACC)
formula (Brealey, Myers, & Allen, 2008).
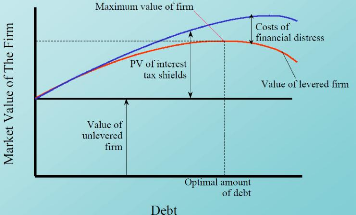
The WACC formula is of particular interest for our concerns,
because it gives a good estimation of the company cost of capital, which can be
reduced by financing the company using the optimal amount of debt as the
traditional approach suggests (Brealey, Myers, & Allen, 2008, p. 504).
Figure 1 illustrates this theory.

Figure 1: The optimal amount of debt to reduce the
company cost of capital Source: Principles of Corporate Finance
In the French farming industry, the NPV methodology is nearly
never used. When this method is
used, discount factors are chosen without
clear explanations, and we can observe important
variations between practitioners, even in the same business
unit. Is it because everyone considers that there is merely no risk in farming
business? However, such hypothesis does not make sense considering that a farm
manager needs to handle the weather risk, the crop's pests risk and the price
volatility risk. Is the WACC methodology not applicable in farming business, or
just the NPV method is not enough known and risks related to farming business
poorly assessed?
1.1 The Farming Business in France
French agricultural exportations represent USD 17.5 billion
(€ 13.2 billion) (Agreste, 2011; IMF.Stat, 2012), making France the
14th biggest exporter of agricultural products in 2010 (WTO, 2011).
Regarding food, France is the number three exporter in 2010, with USD 47.8
billion (€ 36.2 billion)(Agreste, 2011; WTO, 2011; IMF.Stat, 2012). France
is also the number one agricultural producer in Europe, with € 62.0
billion in 2009 over a global European production of € 327 billion
(Agreste, 2010). This high level of production and exportations is allowed by
two factors: productivity and surface. The total cultivated area (TCA) in
France represents 29.3 M ha in 2009, over the total 54.9 M ha of France
(Agreste, 2010), and wheat yields of 7.04 T/ha are 88% superior to the world
average of 3.74 T/ha (FAO, 2012).
However, the high level of production in France is not due to
the size of the farms, because the average farm in France is only 55 ha in 2010
(Agreste, 2011 b) against 350 ha for US farms (Ambassade de France à
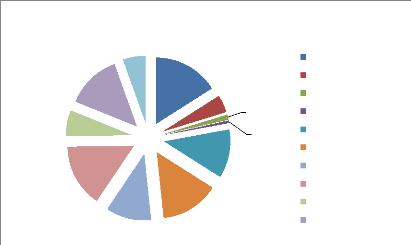
Washington, 2009). The diversity of production is really high in France as we
can see in Figure 1, as no production represent more than 16% of the overall
production in value.

Grains
Oilseeds and soyabean Sugar beet
Other plants
Fruits & vegetables Wines
Forage crops
Cattle
Poultry
Milk
Source: Insee 2011 in Billion euros
Agricultural production in France, 2010
4,1
10,1
8,8
7,3
3,6
10,5
9,4
7,8
2,8
0,8
0,4
Figure 2: Agricultural production in France,
2010
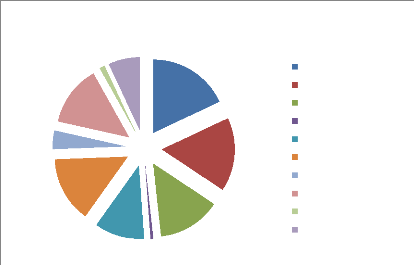
Regarding Isère, the production is also really
diversified as we can see in Figure 3. The overall production represents €
516 million for 2010, for a total GDP of around € 33 billion in
Isère for 2009 (CCI Rhône Alpes, 2011). The average size of the
farms in the department is smaller compare to France with only 38 ha in 2010
(Agreste, 2011 c), and the TCA in Isère (241 300 ha) represents only
0.8% of the national TCA.

3,0
Source: Agreste 2011 in Million euros
21,0
75,0
Agricultural production in Isère, 2010
69,0
6,0
57,0
36,0
72,0
93,0
84,0
Grains
Other plants
Fruits & vegetables Wines
Forage crops
Cattle Poultry Milk
Other animal productions Services
Figure 3: Agricultural production in Isère,
2010
| 


