4.2.2.2 ROE for Dairy Producers
The group of dairy producers represents 141 different farms
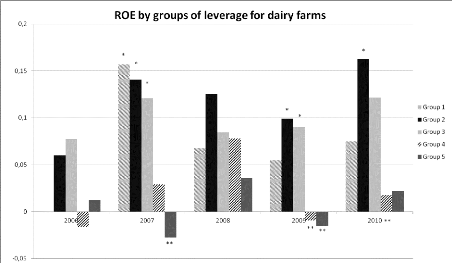
studied over the 5 years. The Figure 18 presents the results of the Mood's
median tests performed for the ROE of the different groups. First, we can see
that the groups 4 and 5, which are the lowest leverages, have the lowest
medians. Then, the group 1 shows sign of financial distress: it has the best
results in 2007 with a ROE higher than 15%, but is close to be the worst group
in 2006 with a ROE close to 0,0%. Groups 2 and 3 seem to be more stable and
closer in terms of results, with an advantage for group 2 which is higher than
group 3 (except in 2006, a bad year for agriculture in Isère as already
presented, explaining that financial distress may have occurs for the most
leveraged farms).

Figure 18: Median ROE for each year and each group of
leverage for dairy * means significantly higher than **
In 2007, group 1, 2 and 3 were significantly better than group
5. In 2009, it was group 2 and 3 which were significantly better than groups 4
and 5. In 2010, only the group 2 over performed the group 4. For all the other
years, there is no statistical difference between groups, and the differences
between the medians cannot be interpreted due to high standard deviation (see
Appendix 8 for details page 89).
4.2.2.3 ROE for Grain Producers
The group of grain producers represents 126 farms of
Isère. The sample is constant over the 5 years.
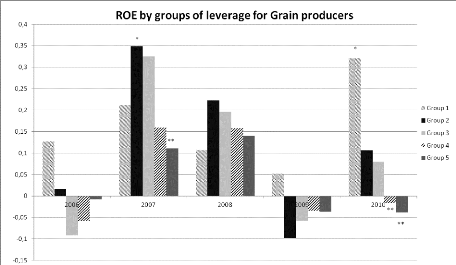
The Figure 19
represents the ROE for each year and each group. First, group 1 over performed
in
2006, 2009 and 2010. This is quite surprising, because 2009 wasn't a good
year in terms of price of
grains, and we could have expected signs of financial
distress. However, except in 2010, there is no statistical difference showing
that group 1 is better than any other groups. This could be surprising
regarding the major difference seen in the histograms, but standard deviations
are really high for group 1, with a lot of extreme values (see Appendix 10 page
99 for standard deviations).

Figure 19 : Median ROE for each year and each group of
leverage for grain * means significantly higher than **
In 2007, the group 2 has significantly better results than the
group 5. For 2010, it is group 1 which has better results than groups 4 and 5.
For 2006, 2008 and 2009, no statistical conclusion can be made because the
Mood's Median and Kruskal-Wallis tests did not reveal any significant results,
with P-Values higher than 10% (see Appendix 10 page 99).
4.2.2.4 ROE for Cattle Ranching
For the group of cattle producers, only 45 specialized
producers were represented. As the sample is really small, the differences
between the groups are in most cases not significant due to the limited number
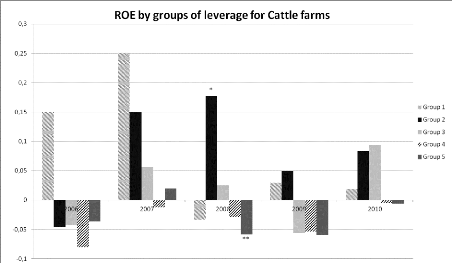
of values in each group of leverage (see Appendix 9 page 95). In figure 18
group 2 seems to over perform the other groups. Years 2007, 2008 and 2010 seem
to illustrate that performance increases with leverage, up to a limit at 80%
where financial distress may occurs. However, Group 2 is significantly higher
than group 5 only in 2008. We cannot conclude anything else from the results of
the statistical tests.

Figure 20: Median ROE for each year and each group of
leverage for cattle * means significantly higher than **
| 


