4.1.2 The Maximum Weighting Scheme
The maximum weighting scheme so far was not taken into
consideration in the previous discussions since it has a different connotation
and could not bear a reasonable comparison with the other approaches. This
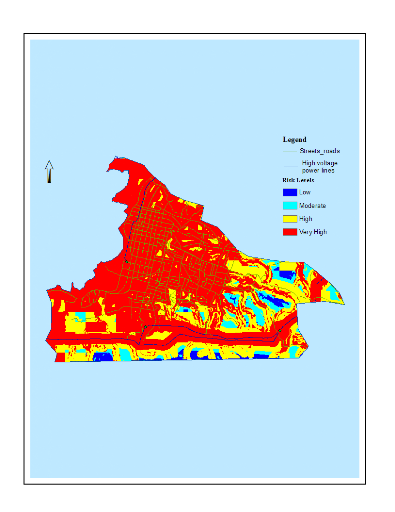
function tends to maximize risk. Because of this a high percentage, 92.5%, of
the area was found exposed at high and very high risks for all the hazards
combined, which is a huge contrast to the results above. In this approach,
since no weight was allocated, the cell with the biggest value rules over the
others. Simply put, the result signifies that for this specific cell, there is
at least one health hazard whose risk level corresponds to this maximum value.
This method was chosen intentionally so as to bring forth the diversity of high
risks prevailing in almost the entire area (Figure 6). This situation also
reveals the lessening of individual factors' significance in aid of the
collective importance of the model. Policies interested rather in solving
environmental problems that arise from a specific field may find this approach
more attractive and more practical.

Figure 6: Environmental
Health Risks in Port-au-Prince - Maximum combination technique using the
Geometric Interval classification method
This approach also outlines the specific location and extent of
each hazard considered. For instance, someone accustomed to the area can
clearly notice the path of high voltage power lines and the prism of risks in
its neighborhood. Likewise, pollution associated to the proximity of the sea
and of vehicle traffic is obvious.
The opposite procedure consisted of determining whether some
areas were exposed simultaneously at high risk for all the hazards overlaid. A
conditional statement was performed to superimpose all the areas where the
conditions «high risk and very high risk» were met. This situation
was not present in any area. This might be because of the spatial dispersion of
the factors over the entire area.
| 


