Annexes
1. Données de l'échantillon
? Liste des entreprises de l'échantillon
:
Compartiment
|
Secteur
|
Société
|
Principal A
|
Bâtiments et matériaux de construction
|
Ciments du Maroc
|
|
|
Centrale Danone
|
|
|
Managem
|
|
Afriquia Gaz
|
Principal B
|
Chimie
|
Maghreb Oxygène
|
|
|
Cartier Saada
|
|
|
Southema
|
|
|
|
Néxans Maroc
|
|
IB Maroc
|
|
|
|
Delattre
|
|
Dari Couspate
|
|
Minière Touissit
|
|
|
Realis Mécaniques
|
|
Lydec
|
|
Med paper
|
|
CTM
|
|
2. Données de l'analyse
économétrique ? Données statistiques des
variables
Période 2011-2018
Statistiques descriptives, utilisant les observations 1:1 -
25:8
|
Variable
|
Moyenne
|
Médiane
|
Minimum
|
Maximum
|
|
END_net
|
0,496321
|
0,246321
|
-9,87143
|
38,3000
|
|
RENT
|
0,0686986
|
0,0555307
|
-0,265957
|
0,368154
|
|
LQD
|
0,170271
|
0,0859255
|
-0,131579
|
1,38889
|
|
AUT
|
0,747942
|
0,839734
|
-3,45455
|
1,35664
|
|
SA
|
0,221610
|
0,201637
|
0,00000
|
0,623035
|
|
TAILLE
|
2,83279
|
2,73984
|
1,30103
|
3,91233
|
|
DFRS
|
0,531819
|
0,520328
|
0,00908833
|
1,00000
|
|
INT
|
0,0524504
|
0,0160294
|
0,00000
|
0,818681
|
~ 69 ~
Variable
|
Écart type
|
C.V.
|
Asymétrie
|
Ex. aplatissement
|
|
END_net
|
3,16711
|
6,38116
|
8,50231
|
102,224
|
|
RENT
|
0,0915906
|
1,33322
|
0,391872
|
2,18568
|
|
LQD
|
0,229855
|
1,34993
|
2,33244
|
6,77211
|
|
AUT
|
0,412460
|
0,551461
|
-5,88218
|
52,9948
|
|
SA
|
0,174706
|
0,788351
|
0,402701
|
-0,854989
|
|
TAILLE
|
0,663412
|
0,234190
|
-0,00111975
|
-0,937835
|
|
DFRS
|
0,291785
|
0,548655
|
0,0832479
|
-1,06013
|
|
INT
|
0,132593
|
2,52798
|
4,48469
|
19,8600
|
|
|
Variable
|
5% Perc.
|
95% Perc.
|
IQ range
|
Missing obs.
|
|
END_net
|
-0,629818
|
1,64511
|
0,793738
|
0
|
|
RENT
|
-0,0587125
|
0,265986
|
0,0927589
|
0
|
|
LQD
|
0,00100685
|
0,625546
|
0,224342
|
0
|
|
AUT
|
0,118014
|
1,00000
|
0,303007
|
0
|
|
SA
|
0,00277513
|
0,538661
|
0,298895
|
0
|
|
TAILLE
|
1,72508
|
3,83420
|
1,20166
|
0
|
|
DFRS
|
0,0898214
|
1,00000
|
0,470452
|
0
|
|
INT
|
0,00227735
|
0,129095
|
0,0279456
|
0
|
? Matrice de corrélation
Période 2011-2018
Coefficient de corrélation, utilisant les observations
1:1 - 25:8
5% valeur critique (bilatéral) = 0,1388 pour n = 200
|
Variable
|
END_NET
|
RENT
|
LQD
|
AUT
|
SA
|
TAILL
E
|
DFRS
|
INT
|
|
END_NET
|
1.00000
|
-0.1798
|
0.2545
|
0.0039
|
0.0246
|
-0.0662
|
-0.1734
|
0.0862
|
|
RENT
|
|
1.0000
|
0.2305
|
0.3108
|
0.1928
|
0.2906
|
0.3088
|
-0.1844
|
|
LQD
|
|
|
1.0000
|
-0.0532
|
-0.0701
|
0.2115
|
0.3239
|
-0.1685
|
|
AUT
|
|
|
|
1.0000
|
-0.0763
|
-0.0386
|
0.2415
|
-0.0591
|
|
SA
|
|
|
|
|
1.0000
|
0.3809
|
-0.0088
|
-0.2331
|
|
TAILLE
|
|
|
|
|
|
1.0000
|
0.3307
|
-0.2359
|
|
DFRS
|
|
|
|
|
|
|
1.0000
|
-0.4273
|
|
INT
|
|
|
|
|
|
|
|
1.0000
|
? Estimation du modèle à effets
fixes
Dependent Variable: END_NET
Method: Panel Least Squares
Date: 12/02/20 Time: 17:47
Sample: 2011 2018
Periods included: 8
Cross-sections included: 25
Total panel (balanced) observations: 200
|
Variable
|
Coefficient Std. Error
|
t-Statistic
|
Prob.
|
|
C
|
0.089326 5.671780
|
0.015749
|
0.9875
|
|
RENT
|
-5.008736 3.773490
|
-1.327348
|
0.1862
|
|
LQD
|
8.989841 1.197905
|
7.504636
|
0.0000
|
|
AUT
|
2.464445 0.708971
|
3.476084
|
0.0006
|
|
SA
|
13.32275 4.790238
|
2.781229
|
0.0060
|
|
TAILLE
|
-1.479546 1.957704
|
-0.755756
|
0.4509
|
|
DFRS
|
-2.883841 1.339552
|
-2.152840
|
0.0328
|
|
INT
|
2.852104 5.499950
|
0.518569
|
0.6047
|
|
Effects Specification
|
|
|
|
Cross-section fixed (dummy variables)
|
|
|
|
R-squared
|
0.358401 Mean dependent var
|
|
0.496321
|
|
Adjusted R-squared
|
0.240011 S.D. dependent var
|
|
3.167106
|
|
S.E. of regression
|
2.761000 Akaike info criterion
|
|
5.014709
|
|
Sum squared resid
|
1280.684 Schwarz criterion
|
|
5.542440
|
|
Log likelihood
|
-469.4709 Hannan-Quinn criter.
|
|
5.228274
|
|
F-statistic
|
3.027282 Durbin-Watson stat
|
|
1.580054
|
|
Prob(F-statistic)
|
0.000003
|
|
|
|
? Test de spécification de Fisher
Redundant Fixed Effects Tests Equation: Untitled
Test cross-section fixed effects
|
|
|
|
|
Effects Test
|
Statistic
|
d.f.
|
Prob.
|
|
Cross-section F
Cross-section Chi-square
|
1.619928
41.633305
|
(24,168)
24
|
0.0418
0.0142
|
? Test de spécification de Hausman
Correlated Random Effects - Hausman Test Equation: Untitled
Test cross-section random effects
Test Summary Chi-Sq. Statistic Chi-Sq. d.f. Prob.
Cross-section random 32.561993 7 0.0000 < 5%
~ 70 ~
~ 71 ~
.24
.22
.20
.18
.16
.14
2.86
2.84
2.82
2.80
2.78
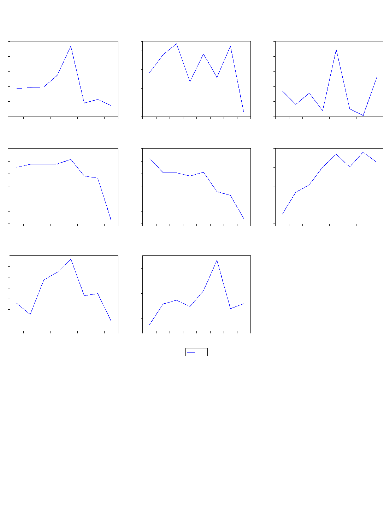
? Présentation graphique
? Tendance moyenne des variables
Mean of END net
2011 2012 2013 2014 2015 2016 2017 2018
Mean of AUT
2011 2012 2013 2014 2015 2016 2017 2018
Mean of DFRS
2011 2012 2013 2014 2015 2016 2017 2018
Mean of RENT
2011 2012 2013 2014 2015 2016 2017 2018
Mean of SA
2011 2012 2013 2014 2015 2016 2017 2018
Mean of INT
2011 2012 2013 2014 2015 2016 2017 2018
2.0
1.5
1.0
0.5
0.0
-0.5
.85
.80
.75
.70
.65
.60
.55
.60
.58
.56
.54
.52
.50
.48
.46
.080
.076
.072
.068
.064
.060
.056
.052
.048
.235
.230
.225
.220
.215
.210
.205
.070
.065
.060
.055
.050
.045
.040
Mean
Mean of LQD
2011 2012 2013 2014 2015 2016 2017 2018
Mean of TAILLE
2011 2012 2013 2014 2015 2016 2017 2018
|
|


