ANNEXE R : Résultat de l'analyse
économétrique sur SPSS pour le type II
Correlations
|
Pearson
Correlation
|
|
Q
|
Z1
|
Z2
|
Z3
|
|
Q
|
1.000
|
-.773
|
.754
|
.750
|
|
Z1
|
-.773
|
1.000
|
-.420
|
-.530
|
|
Z2
|
.754
|
-.420
|
1.000
|
.423
|
|
Z3
|
.750
|
-.530
|
.423
|
1.000
|
Model Summaryb
|
Mode
|
R
|
R
Square
|
Adjusted
R
Square
|
Std.
Error of
the
Estimate
|
Change Statistics
|
|
R
Square
Change
|
F
Change
|
df1
|
df2
|
Sig. F
Change
|
|
1
|
.951a
|
.904
|
.875
|
7.148
|
.904
|
31.447
|
3
|
10
|
.000
|
a Predictors: (Constant), Z3, Z2, Z1
b Dependent Variable: Q
ANOVAb
|
Model
|
Sum of
Squares
|
df
|
Mean Square
|
F
|
Sig.
|
|
1 Regression
|
4820.721
|
3
|
1606.907
|
31.447
|
.000a
|
|
Residual
|
510.993
|
10
|
51.099
|
|
|
|
Total
|
5331.714
|
13
|
|
|
|
a Predictors: (Constant), Z3, Z2, Z1
b Dependent Variable: Q
30
Coefficientsa
|
Model
|
Unstandardized
Coefficients
|
Standardized Coefficients
|
t
|
Sig.
|
95% Confidence
Interval for B
|
Correlations
|
Collinearity
Statistics
|
|
B
|
Std.
Error
|
Beta
|
Lower
Bound
|
Upper
Bound
|
Zero-order
|
Partial
|
Part
|
Tolerance
|
VIF
|
|
1(Constant)
|
95.412
|
24.502
|
|
3.894
|
.003
|
40.819
|
150.005
|
|
|
|
|
|
|
Z1
|
-
171.072
|
50.694
|
-.403
|
-
3.375
|
.007
|
-
284.025
|
-58.120
|
-.773
|
-.730
|
-
.330
|
.673
|
1.487
|
|
Z2
|
3.423E-
03
|
.001
|
.436
|
3.898
|
.003
|
.001
|
.005
|
.754
|
.777
|
.382
|
.768
|
1.303
|
|
Z3
|
8.193E-
03
|
.003
|
.353
|
2.950
|
.015
|
.002
|
.014
|
.750
|
.682
|
.289
|
.671
|
1.491
|
a Dependent Variable: Q
Coefficient Correlationsa
|
Mode
|
Z3
|
Z2
|
Z1
|
|
1
|
Correlations
|
Z3
|
1.000
|
-.260
|
.428
|
|
Z2
|
-.260
|
1.000
|
.255
|
|
Z1
|
.428
|
.255
|
1.000
|
|
Covariances
|
Z3
|
7.716E-06
|
-6.349E-07
|
6.025E-02
|
|
Z2
|
-6.349E-07
|
7.708E-07
|
1.137E-02
|
|
Z1
|
6.025E-02
|
1.137E-02
|
2569.863
|
a Dependent Variable: Q
31
Collinearity Diagnosticsa
|
Model
|
Dimension
|
Eigenvalue
|
Condition
Index
|
Variance Proportions
|
|
(Constant)
|
Z1
|
Z2
|
Z3
|
|
1
|
1
|
3.755
|
1.000
|
.00
|
.00
|
.00
|
.01
|
|
2
|
.188
|
4.475
|
.00
|
.01
|
.00
|
.57
|
|
3
|
5.327E-02
|
8.396
|
.01
|
.02
|
.83
|
.23
|
|
4
|
3.676E-03
|
31.962
|
.99
|
.96
|
.16
|
.19
|
a Dependent Variable: Q
Casewise Diagnosticsa
|
Case Number
|
Std. Residual
|
Q
|
Predicted Value
|
Residual
|
|
1
|
-.288
|
40
|
42.06
|
-2.06
|
|
2
|
-.237
|
45
|
46.70
|
-1.70
|
|
3
|
-.278
|
47
|
48.99
|
-1.99
|
|
4
|
-.248
|
58
|
59.77
|
-1.77
|
|
5
|
1.796
|
65
|
52.16
|
12.84
|
|
6
|
-.636
|
72
|
76.55
|
-4.55
|
|
7
|
1.105
|
75
|
67.10
|
7.90
|
|
8
|
-.468
|
75
|
78.35
|
-3.35
|
|
9
|
.715
|
81
|
75.89
|
5.11
|
|
10
|
.476
|
84
|
80.60
|
3.40
|
|
11
|
-.621
|
95
|
99.44
|
-4.44
|
|
12
|
.222
|
97
|
95.41
|
1.59
|
|
13
|
.303
|
100
|
97.83
|
2.17
|
|
14
|
-1.840
|
48
|
61.16
|
-13.16
|
a Dependent Variable: Q
32
Histogram
Dependent Variable: Q
|
Frequency
|
6 5 4 3 2
1
0
|
|
Std. Dev = .88 Mean = 0.00 N = 14.00
|
-2.00 -1.50 -1.00 -.50 0.00 .50 1.00 1.50 2.00
Regression Standardized Residual
Normal P-P Plot of Regression Standar Dependent Variable: Q
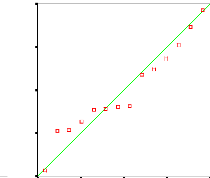
Expected Cum Prob
0.00
1.00
.75
.50
.25
0.00 .25 .50 .75 1.00
Observed Cum Prob
33
Partial Regression Plot
Dependent Variable: Q

Q
-10
-20
20
10
0
-.1 0.0 .1
Z1
Partial Regression Plot Dependent Variable: Q

Q
-10
-20
-30
20
10
0
Z2
-4000 -2000 0 2000 4000 6000
34
Partial Regression Plot Dependent Variable: Q

Q
-10
-20
20
10
0
-2000 -1000 0 1000 2000
Z3
35
| 

