3.7. Forest canopy change and remote sensing
Researchers have found relationships between vegetation
properties and remotely sensed variables. In order to summarize these diverse
experiments, basal area and canopy cover, and the volume and productivity
variable includes age, height, volume, diameter and density. Brockhaus et al.,
(1992) found a significant relationship between green TM band (2) with basal
area of trees.
More recent work by Fiorella et al. (2003) found that ratios
of near-infrared/red and near-infrared/middle-infrared correlated with
structural forms. Cook et al (1989) discovered that vegetation productivity is
more strongly related to band ratios than individual bands.
Both the volume and the aboveground biomass (AGB) of forests
can be estimated from allometri c relationships with canopy width, structure,
and/or height, the intensity of SAR backscatter, corr
17
Nelson et al (1984) analyzed (simulated) TM data, and
concluded most information about vegetation was contained in the blue,
near-infrared and middle-infrared. Thermal infrared was used by Holbo and
Luvall (1989) to map broad forest type classes. Vegetation dieback and damage
are best mapped by band ratios.
3.8. Comparing Forest Inventory and Remote Sensing
Measurement for forest degradation mapping
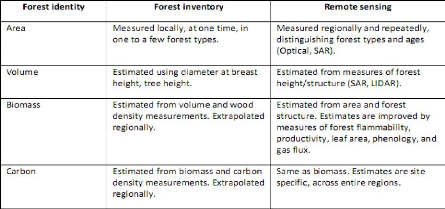
The same forest quantities (e.g., biomass) are estimated
differently by ground forest inventory and by remote sensing . Forest inventory
typically measures tree abundance, diameter, crown width, species, and height
(Song 2007; Chave et al. 2005).
Table 5. How Forest Inventory and Remote Sensing Estimate the
Forest Identity, adapted from Fragn et al,2009.

Remote sensing measures reflected spectra, forest area and the
horizontal and vertical structure of forests can be measured directly from
these reflected spectra. Fieldwork or higher resolution imagery can be used to
generate ground-truth data to assess the accuracy of these forest area and
structure measurements (Jensen 2007).
3.9. Estimating Forest Volume Using Remote Sensing
18
elations with passive spectra, and various fusions of the above
(Lu et al. 2006; Balzter et al. 2007; Rosenqvist et al. 2003).
3.10. Estimating forest biomass using remote
sensing
Biomass cannot be directly measured from remote sensing data,
however remotely sensed reflectance can be related to the biomass estimates
based on in situ measurements (Dong et al. 2003). Reflections of the red, green
and near infrared radiances contained considerable information about forest
biomass. Two main approaches predicting biomass using satellite images are (1)
Use of Solar radiation and (2) Use of Reflection Coefficients (Namayanga 2002),
which is primarily determined by the green foliage biomass (Christensen and
Goudriaan, 1993).
Forest height can be measured from a variety of remotely sensed
data and used to estimate biomass (Kellndorfer et al. 2004; Palace et al. 2008,
Pflugmacher et al. 2008). Although diamete, height, and wood density are
central variables, biomass estimates can be improved by using addit ional
forest structure variables (e.g., canopy width, canopy volume) (Dubayah et al.
2000; Palace et al. 2008; Popescu et al. 2003).
Direct biomass estimation may also be possible with vegetation
Light Detection and Ranging (LIDAR) observations (Popescu 2007; Drake et. al
2002). The potential of forest biomass mapping has also been explored using
Radar (Gaveau et al., 2003; Tomppo et al. 2002) along with JAXA ALOS-PALSAR
L-band (24 cm wavelength) which gives lower range of biomass (upto 50-80 t/ha).
The BIOMASS mission, which is expected to launch around 2014 by ESA uses a
longer wavelength (68 cm) and shows potential of estimating higher levels of
biomass (FAO,2008).
| 


