Article XII.
ANNEXES
ANNEXE 1 : DONNÉES
|
|
VTCH
|
TINF
|
TD
|
VRC
|
VMM
|
|
2013M01
|
0.2
|
0.07
|
4.00
|
-0.02
|
0.29
|
|
2013M02
|
0.2
|
0.07
|
4.00
|
-0.37
|
-0.40
|
|
2013M03
|
0.0
|
0.06
|
4.00
|
4.93
|
8.81
|
|
2013M04
|
0.0
|
0.08
|
4.00
|
0.94
|
-0.48
|
|
2013M05
|
0.0
|
0.12
|
4.00
|
-4.51
|
-0.39
|
|
2013M06
|
0.3
|
0.08
|
4.00
|
-1.21
|
1.23
|
|
2013M07
|
0.1
|
0.11
|
4.00
|
-0.20
|
1.36
|
|
2013M08
|
0.3
|
0.08
|
4.00
|
0.78
|
5.68
|
|
2013M09
|
0.3
|
0.09
|
4.00
|
4.24
|
-2.05
|
|
2013M10
|
0.6
|
0.12
|
3.00
|
-1.20
|
2.16
|
|
2013M11
|
0.4
|
0.08
|
2.00
|
-0.49
|
2.26
|
|
2013M12
|
0.5
|
0.12
|
2.00
|
4.10
|
1.68
|
|
2014M01
|
0.1
|
0.15
|
2.00
|
2.22
|
0.99
|
|
2014M02
|
0.2
|
0.11
|
2.00
|
-0.05
|
0.34
|
|
2014M03
|
0.0
|
0.09
|
2.00
|
5.40
|
4.19
|
|
2014M04
|
0.3
|
0.09
|
2.00
|
-2.76
|
-0.27
|
|
2014M05
|
0.0
|
0.12
|
2.00
|
0.08
|
2.58
|
|
2014M06
|
0.0
|
0.07
|
2.00
|
-4.93
|
1.23
|
|
2014M07
|
0.1
|
0.13
|
2.00
|
1.06
|
0.10
|
|
2014M08
|
0.0
|
0.09
|
2.00
|
0.22
|
1.94
|
|
2014M09
|
0.1
|
0.12
|
2.00
|
-2.09
|
-0.72
|
|
2014M10
|
0.2
|
0.11
|
2.00
|
-0.49
|
2.07
|
|
2014M11
|
0.1
|
0.08
|
2.00
|
-0.31
|
-0.18
|
|
2014M12
|
0.2
|
0.09
|
2.00
|
-3.88
|
1.64
|
|
2015M01
|
0.1
|
0.13
|
2.00
|
6.51
|
2.67
|
|
2015M02
|
0.2
|
0.10
|
2.00
|
-0.99
|
0.79
|
|
2015M03
|
0.0
|
0.10
|
2.00
|
-2.20
|
0.17
|
|
2015M04
|
0.0
|
0.14
|
2.00
|
1.10
|
0.41
|
|
2015M05
|
0.1
|
0.11
|
2.00
|
-3.73
|
3.02
|
|
2015M06
|
0.0
|
0.11
|
2.00
|
-3.22
|
1.92
|
|
2015M07
|
0.0
|
0.13
|
2.00
|
2.59
|
-0.90
|
|
2015M08
|
0.0
|
0.15
|
2.00
|
-3.64
|
-1.56
|
|
2015M09
|
0.1
|
0.21
|
2.00
|
-6.11
|
0.15
|
|
2015M10
|
0.1
|
0.14
|
2.00
|
-2.58
|
-1.79
|
|
2015M11
|
0.0
|
0.11
|
2.00
|
2.20
|
1.80
|
|
2015M12
|
0.2
|
0.16
|
2.00
|
-4.90
|
1.80
|
|
2016M01
|
0.5
|
0.10
|
2.00
|
-2.56
|
-4.51
|
|
2016M02
|
0.4
|
0.12
|
2.00
|
-3.54
|
3.72
|
|
2016M03
|
0.7
|
0.15
|
2.00
|
-3.28
|
-1.27
|
|
2016M04
|
2.1
|
0.18
|
2.00
|
-6.52
|
-0.99
|
|
2016M05
|
0.9
|
0.19
|
2.00
|
-1.21
|
-0.24
|
|
2016M06
|
2.5
|
0.91
|
2.00
|
-8.04
|
1.77
|
|
2016M07
|
4.9
|
2.01
|
2.00
|
-5.80
|
0.07
|
|
2016M08
|
1.5
|
0.67
|
2.00
|
-2.15
|
-0.50
|
|
2016M09
|
10.8
|
0.62
|
7.00
|
-7.20
|
1.22
|
|
2016M10
|
2.5
|
2.04
|
7.00
|
-0.25
|
-4.48
|
|
2016M11
|
0.8
|
4.10
|
7.00
|
-4.73
|
-2.21
|
|
2016M12
|
2.4
|
12.70
|
7.00
|
-4.10
|
1.75
|
|
2017M01
|
3.5
|
6.22
|
14.00
|
-7.00
|
1.77
|
|
2017M02
|
1.6
|
2.62
|
14.00
|
-4.13
|
0.06
|
|
2017M03
|
3.1
|
1.82
|
14.00
|
-2.37
|
-2.97
|
|
2017M04
|
3.2
|
2.79
|
14.00
|
0.29
|
4.91
|
|
2017M05
|
1.9
|
3.42
|
14.00
|
-2.82
|
-0.82
|
|
2017M06
|
3.9
|
8.03
|
14.00
|
-1.11
|
0.68
|
|
2017M07
|
8.8
|
9.47
|
20.00
|
2.97
|
-3.13
|
|
2017M08
|
3.3
|
2.74
|
20.00
|
-8.63
|
6.31
|
|
2017M09
|
0.1
|
0.38
|
20.00
|
-1.03
|
1.71
|
|
2017M10
|
0.3
|
0.25
|
20.00
|
11.69
|
0.64
|
|
2017M11
|
0.6
|
0.42
|
20.00
|
9.79
|
0.96
|
|
2017M12
|
1.0
|
1.62
|
20.00
|
4.22
|
2.42
|
|
2018M01
|
1.2
|
1.55
|
20.00
|
-0.31
|
1.48
|
|
2018M02
|
0.2
|
0.79
|
20.00
|
10.29
|
1.83
|
|
2018M03
|
0.1
|
0.55
|
20.00
|
4.79
|
1.08
|
|
2018M04
|
0.2
|
1.22
|
14.00
|
20.02
|
1.32
|
|
2018M05
|
0.3
|
1.56
|
14.00
|
1.81
|
1.38
|
|
2018M06
|
0.1
|
0.58
|
14.00
|
0.30
|
2.19
|
|
2018M07
|
0.0
|
0.18
|
14.00
|
-3.77
|
1.67
|
|
2018M08
|
0.1
|
0.17
|
14.00
|
-4.23
|
2.31
|
|
2018M09
|
0.1
|
0.10
|
14.00
|
-4.93
|
0.38
|
|
2018M10
|
0.0
|
0.23
|
14.00
|
-1.05
|
3.01
|
|
2018M11
|
0.1
|
0.21
|
14.00
|
-2.70
|
0.55
|
|
2018M12
|
0.5
|
0.32
|
14.00
|
-12.52
|
2.50
|
|
2019M01
|
0.0
|
0.60
|
14.00
|
3.89
|
0.38
|
|
2019M02
|
0.0
|
0.42
|
14.00
|
6.16
|
5.53
|
|
2019M03
|
0.4
|
0.27
|
14.00
|
-7.08
|
1.83
|
|
2019M04
|
0.0
|
0.32
|
14.00
|
27.80
|
3.25
|
|
2019M05
|
0.0
|
0.30
|
14.00
|
-7.93
|
2.82
|
|
2019M06
|
0.4
|
0.22
|
14.00
|
-2.50
|
1.17
|
|
2019M07
|
0.2
|
0.19
|
14.00
|
-0.62
|
-0.65
|
|
2019M08
|
0.0
|
0.21
|
14.00
|
-9.39
|
1.84
|
|
2019M09
|
0.2
|
0.21
|
14.00
|
-7.76
|
0.31
|
|
2019M10
|
0.3
|
0.28
|
14.00
|
-1.89
|
4.65
|
|
2019M11
|
1.1
|
0.30
|
14.00
|
1.69
|
-0.22
|
|
2019M12
|
1.3
|
0.53
|
9.00
|
-4.44
|
-0.01
|
|
2020M01
|
0.8
|
0.51
|
9.00
|
-5.45
|
5.57
|
|
2020M02
|
0.6
|
0.26
|
9.00
|
-10.07
|
1.29
|
|
2020M03
|
0.7
|
0.88
|
7.50
|
-0.70
|
0.27
|
|
2020M04
|
2.0
|
2.20
|
7.50
|
41.79
|
0.81
|
|
2020M05
|
5.4
|
2.30
|
7.50
|
-5.81
|
0.64
|
|
2020M06
|
2.7
|
2.55
|
7.50
|
-4.73
|
2.27
|
|
2020M07
|
3.0
|
2.95
|
7.50
|
-5.38
|
1.44
|
|
2020M08
|
0.5
|
1.26
|
7.50
|
-3.44
|
4.37
|
|
2020M09
|
0.5
|
0.38
|
18.50
|
-12.92
|
5.02
|
|
2020M10
|
0.4
|
0.43
|
18.50
|
-3.63
|
-1.33
|
|
2020M11
|
0.3
|
0.40
|
18.50
|
-0.59
|
2.64
|
|
2020M12
|
0.2
|
0.78
|
18.50
|
5.75
|
0.52
|
|
2021M01
|
0.2
|
0.37
|
18.50
|
-2.25
|
6.18
|
|
2021M02
|
0.1
|
0.35
|
18.50
|
-8.72
|
3.79
|
|
2021M03
|
0.0
|
0.31
|
15.50
|
-20.05
|
1.81
|
|
2021M04
|
0.2
|
0.47
|
10.50
|
54.97
|
1.53
|
|
2021M05
|
0.2
|
0.43
|
10.50
|
42.60
|
3.58
|
|
2021M06
|
0.2
|
0.39
|
8.50
|
10.01
|
4.33
|
|
2021M07
|
0.1
|
0.42
|
8.50
|
-35.57
|
0.83
|
|
2021M08
|
0.3
|
0.31
|
8.50
|
308.63
|
3.70
|
|
2021M09
|
0.3
|
0.30
|
8.50
|
1.76
|
5.67
|
|
2021M10
|
0.3
|
0.38
|
8.50
|
7.80
|
2.94
|
|
2021M11
|
0.2
|
0.54
|
7.50
|
-6.97
|
1.92
|
|
2021M12
|
0.2
|
0.90
|
7.50
|
4.92
|
1.21
|
|
2022M01
|
0.1
|
0.47
|
7.50
|
-21.47
|
-26.49
|
|
2022M02
|
0.4
|
0.41
|
7.50
|
4.00
|
3.79
|
|
2022M03
|
0.1
|
1.41
|
7.50
|
-3.23
|
1.82
|
|
2022M04
|
0.0
|
1.03
|
7.50
|
7.34
|
1.53
|
|
2022M05
|
0.1
|
1.05
|
7.50
|
28.37
|
3.58
|
|
2022M06
|
0.3
|
1.31
|
7.50
|
5.61
|
4.33
|
|
2022M07
|
0.9
|
0.96
|
7.50
|
4.28
|
0.83
|
|
2022M08
|
2.0
|
1.10
|
7.50
|
5.75
|
3.71
|
|
2022M09
|
0.6
|
1.25
|
7.50
|
-10.83
|
5.67
|
|
2022M10
|
0.0
|
0.70
|
7.50
|
1.36
|
2.94
|
|
2022M11
|
0.6
|
0.83
|
8.25
|
0.61
|
1.92
|
|
2022M12
|
1.0
|
1.09
|
8.25
|
9.65
|
1.21
|
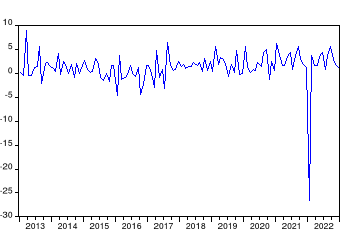
ANNEXE 2 : TEST INFORMEL DE STATIONNARITE
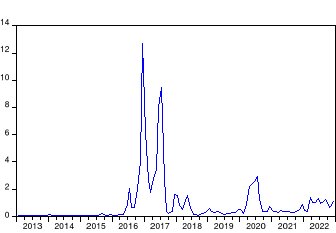
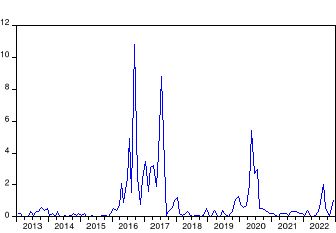
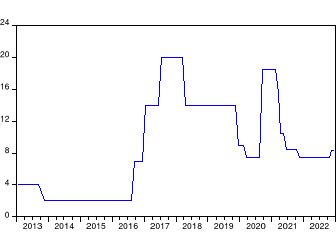
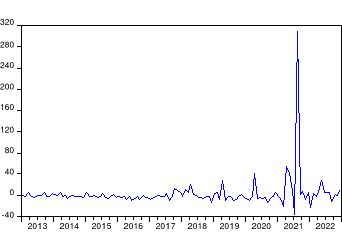
ANNEXE 3 : TEST DE STATONNARITE
|
Null Hypothesis: TINF has a unit root
|
|
|
Exogenous: Constant
|
|
|
|
Lag Length: 1 (Automatic - based on SIC, maxlag=12)
|
|
|
|
|
|
|
|
|
|
|
|
|
|
t-Statistic
|
Prob.*
|
|
|
|
|
|
|
|
|
|
|
|
Augmented Dickey-Fuller test statistic
|
-5.252872
|
0.0000
|
|
Test critical values:
|
1% level
|
|
-3.486551
|
|
|
5% level
|
|
-2.886074
|
|
|
10% level
|
|
-2.579931
|
|
|
|
|
|
|
|
|
|
|
|
|
*MacKinnon (1996) one-sided p-values.
|
|
|
|
|
|
|
|
Null Hypothesis: VTCH has a unit root
|
|
|
Exogenous: Constant
|
|
|
|
Lag Length: 0 (Automatic - based on SIC, maxlag=12)
|
|
|
|
|
|
|
|
|
|
|
|
|
|
t-Statistic
|
Prob.*
|
|
|
|
|
|
|
|
|
|
|
|
Augmented Dickey-Fuller test statistic
|
-6.277892
|
0.0000
|
|
Test critical values:
|
1% level
|
|
-3.486064
|
|
|
5% level
|
|
-2.885863
|
|
|
10% level
|
|
-2.579818
|
|
|
|
|
|
|
|
|
|
|
|
|
*MacKinnon (1996) one-sided p-values.
|
|
|
|
|
|
|
|
Null Hypothesis: D(TD) has a unit root
|
|
|
Exogenous: Constant
|
|
|
|
Lag Length: 0 (Automatic - based on SIC, maxlag=12)
|
|
|
|
|
|
|
|
|
|
|
|
|
|
t-Statistic
|
Prob.*
|
|
|
|
|
|
|
|
|
|
|
|
Augmented Dickey-Fuller test statistic
|
-10.27330
|
0.0000
|
|
Test critical values:
|
1% level
|
|
-3.486551
|
|
|
5% level
|
|
-2.886074
|
|
|
10% level
|
|
-2.579931
|
|
|
|
|
|
|
|
|
|
|
|
|
*MacKinnon (1996) one-sided p-values.
|
|
|
|
|
|
|
|
Null Hypothesis: VRCH has a unit root
|
|
|
Exogenous: Constant
|
|
|
|
Lag Length: 0 (Automatic - based on SIC, maxlag=12)
|
|
|
|
|
|
|
|
|
|
|
|
|
|
t-Statistic
|
Prob.*
|
|
|
|
|
|
|
|
|
|
|
|
Augmented Dickey-Fuller test statistic
|
-11.82374
|
0.0000
|
|
Test critical values:
|
1% level
|
|
-3.486064
|
|
|
5% level
|
|
-2.885863
|
|
|
10% level
|
|
-2.579818
|
|
|
|
|
|
|
|
|
|
|
|
|
*MacKinnon (1996) one-sided p-values.
|
|
|
|
|
|
|
|
|
|
|
|
|
Null Hypothesis: VMM has a unit root
|
|
|
Exogenous: Constant
|
|
|
|
Lag Length: 0 (Automatic - based on SIC, maxlag=12)
|
|
|
|
|
|
|
|
|
|
|
|
|
|
t-Statistic
|
Prob.*
|
|
|
|
|
|
|
|
|
|
|
|
Augmented Dickey-Fuller test statistic
|
-11.61848
|
0.0000
|
|
Test critical values:
|
1% level
|
|
-3.486064
|
|
|
5% level
|
|
-2.885863
|
|
|
10% level
|
|
-2.579818
|
|
|
|
|
|
|
|
|
|
|
|
|
*MacKinnon (1996) one-sided p-values.
|
|
|
|
|
|
|
ANNEXE 4 : DETERMINATION DE LAG
|
VAR Lag Order Selection Criteria
|
|
|
|
|
Endogenous variables: VTCH TINF TD VRC VMM
|
|
|
|
Exogenous variables: C
|
|
|
|
|
|
Date: 06/09/23 Time: 17:01
|
|
|
|
|
|
Sample: 2013M01 2022M12
|
|
|
|
|
|
Included observations: 116
|
|
|
|
|
|
|
|
|
|
|
|
|
|
|
|
|
|
|
|
Lag
|
LogL
|
LR
|
FPE
|
AIC
|
SC
|
HQ
|
|
|
|
|
|
|
|
|
|
|
|
|
|
|
|
0
|
-1660.447
|
NA
|
2033389.
|
28.71460
|
28.83329
|
28.76278
|
|
1
|
-1443.190
|
412.0392
|
73931.73
|
25.39982
|
26.11196*
|
25.68891*
|
|
2
|
-1428.168
|
27.19480
|
88020.89
|
25.57186
|
26.87744
|
26.10185
|
|
3
|
-1391.152
|
63.82003
|
71980.76
|
25.36469
|
27.26372
|
26.13559
|
|
4
|
-1365.323
|
42.30578*
|
71767.83*
|
25.35040*
|
27.84288
|
26.36220
|
|
|
|
|
|
|
|
|
|
|
|
|
|
|
|
|
|
|
|
|
|
|
* indicates lag order selected by the criterion
|
|
|
|
LR: sequential modified LR test statistic (each test at 5%
level)
|
|
|
FPE: Final prediction error
|
|
|
|
|
|
AIC: Akaike information criterion
|
|
|
|
|
SC: Schwarz information criterion
|
|
|
|
|
HQ: Hannan-Quinn information criterion
|
|
|
|
ANNEXE 5 : ESTIMATION DU VAR
|
Vector Autoregression Estimates
|
|
|
|
|
Date: 07/19/23 Time: 17:43
|
|
|
|
|
Sample (adjusted): 2013M02 2022M12
|
|
|
|
|
Included observations: 119 after adjustments
|
|
|
|
Standard errors in ( ) & t-statistics in [ ]
|
|
|
|
|
|
|
|
|
|
|
|
|
|
|
|
TINF
|
VTCH
|
TD
|
VRCH
|
VMM
|
|
|
|
|
|
|
|
|
|
|
|
|
|
TINF(-1)
|
0.684194
|
0.325230
|
0.518023
|
-0.506888
|
0.046832
|
|
(0.08325)
|
(0.08414)
|
(0.09626)
|
(1.96337)
|
(0.21605)
|
|
[ 8.21860]
|
[ 3.86533]
|
[ 5.38156]
|
[-0.25817]
|
[ 0.21676]
|
|
|
|
|
|
|
|
VTCH(-1)
|
0.007387
|
0.297320
|
-0.152569
|
-1.511586
|
-0.179673
|
|
(0.09182)
|
(0.09280)
|
(0.10617)
|
(2.16547)
|
(0.23829)
|
|
[ 0.08045]
|
[ 3.20384]
|
[-1.43706]
|
[-0.69804]
|
[-0.75400]
|
|
|
|
|
|
|
|
TD(-1)
|
0.002132
|
-0.027288
|
0.925858
|
0.299209
|
0.070904
|
|
(0.02049)
|
(0.02071)
|
(0.02370)
|
(0.48332)
|
(0.05319)
|
|
[ 0.10403]
|
[-1.31744]
|
[ 39.0723]
|
[ 0.61906]
|
[ 1.33314]
|
|
|
|
|
|
|
|
VRCH(-1)
|
6.65E-05
|
0.000978
|
-0.000586
|
-0.091744
|
0.015779
|
|
(0.00399)
|
(0.00403)
|
(0.00461)
|
(0.09409)
|
(0.01035)
|
|
[ 0.01667]
|
[ 0.24259]
|
[-0.12703]
|
[-0.97503]
|
[ 1.52392]
|
|
|
|
|
|
|
|
VMM(-1)
|
-0.042207
|
-0.031409
|
0.041981
|
-0.274673
|
-0.109984
|
|
(0.03613)
|
(0.03652)
|
(0.04178)
|
(0.85208)
|
(0.09376)
|
|
[-1.16824]
|
[-0.86014]
|
[ 1.00493]
|
[-0.32236]
|
[-1.17299]
|
|
|
|
|
|
|
|
C
|
0.328868
|
0.560582
|
0.279164
|
2.451502
|
0.893032
|
|
(0.21605)
|
(0.21836)
|
(0.24981)
|
(5.09530)
|
(0.56069)
|
|
[ 1.52221]
|
[ 2.56726]
|
[ 1.11751]
|
[ 0.48113]
|
[ 1.59272]
|
|
|
|
|
|
|
|
|
|
|
|
|
|
R-squared
|
0.489158
|
0.342779
|
0.940606
|
0.019406
|
0.045653
|
|
Adj. R-squared
|
0.466554
|
0.313698
|
0.937978
|
-0.023983
|
0.003425
|
|
Sum sq. resids
|
190.2174
|
194.3101
|
254.3129
|
105802.0
|
1281.173
|
|
S.E. equation
|
1.297436
|
1.311319
|
1.500185
|
30.59904
|
3.367167
|
|
F-statistic
|
21.64065
|
11.78719
|
357.9077
|
0.447266
|
1.081106
|
|
Log likelihood
|
-196.7618
|
-198.0284
|
-214.0405
|
-572.8707
|
-310.2500
|
|
Akaike AIC
|
3.407762
|
3.429049
|
3.698159
|
9.728919
|
5.315125
|
|
Schwarz SC
|
3.547885
|
3.569173
|
3.838283
|
9.869043
|
5.455249
|
|
Mean dependent
|
0.927815
|
0.826891
|
8.768908
|
2.756471
|
1.307227
|
|
S.D. dependent
|
1.776400
|
1.582890
|
6.023802
|
30.23858
|
3.372948
|
|
|
|
|
|
|
|
|
|
|
|
|
|
Determinant resid covariance (dof adj.)
|
52925.35
|
|
|
|
|
Determinant resid covariance
|
40862.14
|
|
|
|
|
Log likelihood
|
-1476.037
|
|
|
|
|
Akaike information criterion
|
25.31155
|
|
|
|
|
Schwarz criterion
|
26.01217
|
|
|
|
|
Number of coefficients
|
30
|
|
|
|
|
|
|
|
|
|
|
|
|
|
|
|
ANNEXE 6 : TEST DE CAUSALITE
|
Pairwise Granger Causality Tests
|
|
Date: 06/09/23 Time: 17:04
|
|
Sample: 2013M01 2022M12
|
|
Lags: 1
|
|
|
|
|
|
|
|
|
|
|
|
Null Hypothesis:
|
Obs
|
F-Statistic
|
Prob.
|
|
|
|
|
|
|
|
|
|
TINF does not Granger Cause VTCH
|
119
|
13.6513
|
0.0003
|
|
VTCH does not Granger Cause TINF
|
0.02224
|
0.8817
|
|
|
|
|
|
|
|
|
|
TD does not Granger Cause VTCH
|
119
|
0.43280
|
0.5119
|
|
VTCH does not Granger Cause TD
|
2.65172
|
0.1062
|
|
|
|
|
|
|
|
|
|
VRC does not Granger Cause VTCH
|
119
|
0.00870
|
0.9259
|
|
VTCH does not Granger Cause VRC
|
0.88417
|
0.3490
|
|
|
|
|
|
|
|
|
|
VMM does not Granger Cause VTCH
|
119
|
1.05305
|
0.3069
|
|
VTCH does not Granger Cause VMM
|
0.43879
|
0.5090
|
|
|
|
|
|
|
|
|
|
TD does not Granger Cause TINF
|
119
|
0.00343
|
0.9534
|
|
TINF does not Granger Cause TD
|
29.5406
|
3.E-07
|
|
|
|
|
|
|
|
|
|
VRC does not Granger Cause TINF
|
119
|
0.01915
|
0.8902
|
|
TINF does not Granger Cause VRC
|
0.41377
|
0.5213
|
|
|
|
|
|
|
|
|
|
VMM does not Granger Cause TINF
|
119
|
1.42579
|
0.2349
|
|
TINF does not Granger Cause VMM
|
0.00084
|
0.9769
|
|
|
|
|
|
|
|
|
|
VRC does not Granger Cause TD
|
119
|
0.01753
|
0.8949
|
|
TD does not Granger Cause VRC
|
0.18839
|
0.6651
|
|
|
|
|
|
|
|
|
|
VMM does not Granger Cause TD
|
119
|
0.28418
|
0.5950
|
|
TD does not Granger Cause VMM
|
1.73100
|
0.1909
|
|
|
|
|
|
|
|
|
|
VMM does not Granger Cause VRC
|
119
|
0.02933
|
0.8643
|
|
VRC does not Granger Cause VMM
|
2.45715
|
0.1197
|
|
|
|
|
|
|
|
|
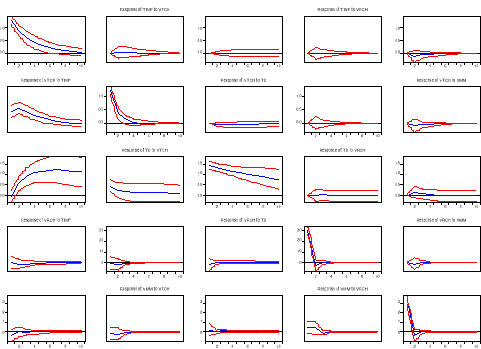
ANNEXE 7 :ANALYSE DE LA REPONSE
IMPULSIONNELLE
ANNEXE 8 : DECOMPOSITION DE LA
VARIANCE
|
|
|
|
|
|
|
|
|
|
|
|
|
|
|
Variance Decomposition of TINF:
|
|
|
|
|
|
|
|
Period
|
S.E.
|
TINF
|
VTCH
|
TD
|
VRCH
|
VMM
|
|
|
|
|
|
|
|
|
|
|
|
|
|
|
|
1
|
1.225574
|
100.0000
|
0.000000
|
0.000000
|
0.000000
|
0.000000
|
|
2
|
1.598963
|
99.23663
|
0.048113
|
0.000114
|
0.011002
|
0.704138
|
|
3
|
1.735624
|
93.08959
|
3.904555
|
0.031424
|
0.018053
|
2.956383
|
|
4
|
1.801802
|
87.95920
|
8.283526
|
0.071149
|
0.057294
|
3.628833
|
|
5
|
1.832809
|
85.47154
|
10.71769
|
0.089055
|
0.110070
|
3.611646
|
|
6
|
1.846686
|
84.50881
|
11.70096
|
0.091943
|
0.123171
|
3.575116
|
|
7
|
1.853589
|
84.13731
|
12.08594
|
0.092239
|
0.125165
|
3.559340
|
|
8
|
1.857362
|
83.96636
|
12.26125
|
0.092481
|
0.125696
|
3.554216
|
|
9
|
1.859475
|
83.86953
|
12.35822
|
0.092873
|
0.126046
|
3.553326
|
|
10
|
1.860650
|
83.81139
|
12.41574
|
0.093307
|
0.126332
|
3.553231
|
|
|
|
|
|
|
|
|
|
|
|
|
|
|
|
Variance Decomposition of VTCH:
|
|
|
|
|
|
|
|
Period
|
S.E.
|
TINF
|
VTCH
|
TD
|
VRCH
|
VMM
|
|
|
|
|
|
|
|
|
|
|
|
|
|
|
|
1
|
1.313896
|
9.288417
|
90.71158
|
0.000000
|
0.000000
|
0.000000
|
|
2
|
1.478255
|
23.13231
|
75.97066
|
0.556471
|
0.015342
|
0.325212
|
|
3
|
1.571219
|
27.21622
|
71.65076
|
0.605088
|
0.062100
|
0.465833
|
|
4
|
1.616373
|
27.87164
|
70.54793
|
0.668016
|
0.061071
|
0.851343
|
|
5
|
1.638246
|
27.72687
|
70.51456
|
0.715748
|
0.071639
|
0.971186
|
|
6
|
1.647632
|
27.59779
|
70.56204
|
0.772082
|
0.079157
|
0.988938
|
|
7
|
1.651610
|
27.53180
|
70.56136
|
0.833772
|
0.081068
|
0.992000
|
|
8
|
1.653299
|
27.49641
|
70.53639
|
0.893235
|
0.081346
|
0.992616
|
|
9
|
1.654088
|
27.47302
|
70.50647
|
0.946724
|
0.081349
|
0.992441
|
|
10
|
1.654558
|
27.45771
|
70.47522
|
0.993783
|
0.081306
|
0.991988
|
|
|
|
|
|
|
|
|
|
|
|
|
|
|
|
Variance Decomposition of TD:
|
|
|
|
|
|
|
|
Period
|
S.E.
|
TINF
|
VTCH
|
TD
|
VRCH
|
VMM
|
|
|
|
|
|
|
|
|
|
|
|
|
|
|
|
1
|
1.519665
|
0.861381
|
8.615285
|
90.52333
|
0.000000
|
0.000000
|
|
2
|
2.121980
|
4.203020
|
4.860881
|
90.47306
|
0.001522
|
0.461521
|
|
3
|
2.629291
|
11.65148
|
4.137772
|
83.87649
|
0.025050
|
0.309215
|
|
4
|
3.088711
|
17.82671
|
4.774912
|
76.90857
|
0.030719
|
0.459084
|
|
5
|
3.498164
|
21.79741
|
6.328482
|
71.13934
|
0.056890
|
0.677882
|
|
6
|
3.857464
|
24.35133
|
8.128763
|
66.58240
|
0.085050
|
0.852451
|
|
7
|
4.170698
|
26.14547
|
9.797928
|
62.96761
|
0.108691
|
0.980301
|
|
8
|
4.442730
|
27.50304
|
11.21117
|
60.08410
|
0.126837
|
1.074861
|
|
9
|
4.678368
|
28.56281
|
12.37782
|
57.76970
|
0.140614
|
1.149049
|
|
10
|
4.881996
|
29.39661
|
13.33978
|
55.90294
|
0.151270
|
1.209397
|
|
|
|
|
|
|
|
|
|
|
|
|
|
|
|
Variance Decomposition of VRCH:
|
|
|
|
|
|
|
|
Period
|
S.E.
|
TINF
|
VTCH
|
TD
|
VRCH
|
VMM
|
|
|
|
|
|
|
|
|
|
|
|
|
|
|
|
1
|
31.17185
|
0.044306
|
0.037971
|
0.241894
|
99.67583
|
0.000000
|
|
2
|
31.41018
|
0.059110
|
0.107105
|
0.621163
|
99.18077
|
0.031854
|
|
3
|
31.63135
|
0.274165
|
0.330136
|
0.693931
|
97.83689
|
0.864880
|
|
4
|
31.65731
|
0.350472
|
0.394791
|
0.700098
|
97.68715
|
0.867489
|
|
5
|
31.67310
|
0.365015
|
0.441623
|
0.730212
|
97.59374
|
0.869412
|
|
6
|
31.68215
|
0.365464
|
0.466389
|
0.757621
|
97.53802
|
0.872506
|
|
7
|
31.68723
|
0.366070
|
0.472380
|
0.782387
|
97.50685
|
0.872314
|
|
8
|
31.69140
|
0.369243
|
0.472670
|
0.804712
|
97.48120
|
0.872174
|
|
9
|
31.69558
|
0.374830
|
0.472852
|
0.824704
|
97.45553
|
0.872081
|
|
10
|
31.69991
|
0.382411
|
0.474468
|
0.842084
|
97.42894
|
0.872095
|
|
|
|
|
|
|
|
|
|
|
|
|
|
|
|
Variance Decomposition of VMM:
|
|
|
|
|
|
|
|
Period
|
S.E.
|
TINF
|
VTCH
|
TD
|
VRCH
|
VMM
|
|
|
|
|
|
|
|
|
|
|
|
|
|
|
|
1
|
3.416630
|
1.018217
|
0.260810
|
0.606715
|
1.745349
|
96.36891
|
|
2
|
3.487652
|
0.979246
|
0.455744
|
1.377675
|
3.235407
|
93.95193
|
|
3
|
3.498425
|
0.978517
|
0.609251
|
1.447854
|
3.575952
|
93.38843
|
|
4
|
3.504376
|
0.976819
|
0.731472
|
1.558862
|
3.587399
|
93.14545
|
|
5
|
3.506497
|
0.977766
|
0.740489
|
1.664176
|
3.584749
|
93.03282
|
|
6
|
3.508421
|
0.987792
|
0.739700
|
1.758013
|
3.581036
|
92.93346
|
|
7
|
3.510451
|
1.010256
|
0.741634
|
1.844724
|
3.577199
|
92.82619
|
|
8
|
3.512560
|
1.043917
|
0.749070
|
1.918362
|
3.573124
|
92.71553
|
|
9
|
3.514735
|
1.084271
|
0.762591
|
1.981834
|
3.568882
|
92.60242
|
|
10
|
3.516894
|
1.126887
|
0.780801
|
2.036922
|
3.564759
|
92.49063
|
|
|
|
|
|
|
|
|
|
|
|
|
|
|
|
Cholesky Ordering: TINF VTCH TD VRCH VMM
|
|
|
|
|
|
|
|
|
|
|
|
|
|
|
|
|
|
| 

