4.2 Comparative analysis
The idea of applying multiple performance criteria at the farm
level is not to evaluate performance in terms of profitability alone but to
find a balance and examine the farm system in relation to the 5 criteria.
4.2.1 Productivity
In the present case productivity is measured in Kilograms per
Unit pivot or hectare (Kg/unit pivot) or (Kg/ha) as shown in the following
table:
Table 1 Productivity of main and secondary product
|
Crop
|
Main Product
|
Secondary Product
|
|
Potato
|
Onion
|
Peanut
|
|
Scenario
|
current
|
improved
|
current
|
improved
|
current
|
improved
|
|
Production (Kg/unit pivot or ha)
|
30,000
|
40,000
|
50,000
|
70,000
|
1,000
|
3,000
|
|
Amelioration
|
+33.33%
|
+40%
|
+200%
|
Source: GIZ/ FBS Potato. 2020. Module 5
Table 1 shows the significant improvements in production.
These improvements are the results of the application of GAP, better management
and adjustment of farm system components and efficiency in the use of resources
to increase yield. The remarkable increase in yield 33.33% for the potato, 40%
for the onion and 200% for the peanut can be explained at this level by using
certified and recommended seeds, fertilizers, which are better adapted to the
medium and give extreme high yield in comparison with the local variety.
4.2.2 Profitability
The profitability of a farm enterprise defined in the part 3.5
Methodological Approach is measured in monetary terms as total gross revenue
minus total costs over the course of a campaign. To measure the economic
profitability; gross margin is one of the performance criteria in the current
case.

21|
The purpose of these parameters is to evaluate the system, the
process and the performance of an activity of a small agricultural enterprise.
This type of evaluation is widely used to structure agricultural development
projects.
The following table consists of a budget which is applied to
the potato production in the current and improved to evaluate the impact of the
improved production on the profitability. To make the comparison, all the
parameters which change by adopting the improved production should be taken
into consideration. These changes also include additional yield, labor use and
reduced transport cost. The result of these changes is an increase in the gross
margin.
The next table for the main product contains a gross margin,
return on investment and unit cost calculation which are performance factors of
a farm, and a quick tool to make a comparison between several scenarios.
The gross margin is hence obtained by subtracting the total
income from the variable costs. Fixed costs are excluded here because it can
enter the production of another activity or for several years of production.
Unit cost is determined by dividing the cost of production by the number of
units produced. The Return on Investment (ROI) is the benefit (or return) of an
investment is divided by the cost of the investment. The result is expressed as
a percentage or a ratio.

22|
Table 2 Potato production Comparative Analysis
|
Input
|
Unity
|
Current Scenario
|
Improved Scenario
|
Change
|
|
Quantity
(kg)
|
Price
(DZD)
|
Total
(DZD)
|
Quantity
|
Price
(DZD)
|
Total
(DZD)
|
%
|
|
Input
|
|
Seeds
|
Kg
|
2,000
|
150
|
300,000
|
3,000
|
150
|
450,000
|
Quantity: +50%
|
|
organic manure
|
Kg
|
20,000
|
4.5
|
90,000
|
30,000
|
4.5
|
135,000
|
Quantity: +50%
|
|
Fertilizer NPK
|
Kg
|
1,200
|
105
|
126,000
|
800
|
105
|
84,000
|
Quantity: -33.33%
|
|
Tractor Service
|
Fixed Price
|
-
|
40,000
|
40,000
|
-
|
40,000
|
40,000
|
No change
|
|
Ammonite 33%
|
Kg
|
-
|
-
|
-
|
150
|
6
|
900
|
+100%
|
|
Potash (K)
|
Kg
|
-
|
-
|
-
|
200
|
195
|
39,000
|
+100%
|
|
Chemical fertilizer
|
Kg
|
3
|
4,000
|
12,000
|
1
|
4,000
|
4,000
|
Quantity: -66.66%
|
|
Treatment ser-
vices
|
l
|
-
|
-
|
-
|
8
|
7,500
|
60,000
|
+100%
|
|
Irrigation water
|
m3
|
5,000
|
4
|
20,000
|
8,000
|
4
|
32,000
|
Quantity: +60%
|
|
Packaging bag
|
bag
|
300
|
260
|
78,000
|
400
|
260
|
104,000
|
Quantity: +33%
|
|
Transport Service
|
Fixed price
|
3
|
25,000
|
75,000
|
1
|
28,000
|
28,000
|
Quantity: -66.66% Total: -62.66% Price: +12%
|
|
Electricity
|
Invoice
|
1
|
50,000
|
50,000
|
1
|
10,000
|
10,000
|
Price: -80%
|
|
Labor
|
Man-day
|
105
|
1,500
|
157,500
|
114
|
1,500
|
171,000
|
+9 Man-day
|
|
Total Variable
Cost
|
|
948,500
|
1,157,900
|
+22%
|
|
Output
|
|
Gross Revenue
|
DZD
|
30,000
|
33
|
990,000
|
40,000
|
34
|
1,360,000
|
Yield: +33.33% Price: +3% Revenue: +37%
|
|
Gross Margin
|
DZD
|
41,500
|
202,100
|
+387%
|
|
ROI
|
(%)
|
4%
|
17%
|
+13%
|
|
Unit Cost
|
DZD
|
31.62
|
28.95
|
-8.4%
|
Source: GIZ/ FBS Potato. 2020. Module 5
Table 2 shows a comparison of the costs for the two scenarios.
In fact, an increase in seeds costs by +50% for seeds are noticed. This is due
to the increase in the quantity of planting. These varieties of seed are of
better quality than the one used in the current scenario and shows better
yields. Also, for irrigation water, 60% additional quantity

23|
was added in the improved scenario for more efficiency and
therefore 60% additional cost at a fixed price per cubic meter. Some treatment
services and fertilizer additives such as ammonite 33% and potash (K) are also
added for the improved scenario marked by + 100% in order to ensure better
growth of tubers. Less than 66% of NPK fertilizer and chemical fertilizer are
used for the production and therefore less cost during the tuber growth face.
The objective is to reduce residues and ensure good potato quality. Regarding
the transport service, at a slightly increased price + 12% and a better
service, there was a need for at least operation -66% and therefore a reduction
in costs of 62%. Following the adoption of the improved scenario, a further
significant reduction in the price of electricity by 80% and consequently 80%
in costs reduced is noticed. For labor, a slight increase in man-day needed + 9
and hence additional employment.
As a result of these changes in the potato production activity
as announced in part 4.3.1 productivity an excess production of 10,000 Kg is
noticed, Furthermore, a remarkable and logical increase in the Gross Revenue
more than 37% following this better productivity and a 3% higher price. What is
very interesting, we notice that only the excess of the gross margin in the
improved scenario is equal to 160,600 DZD almost 4 times the gross margin in
the current scenario. Concerning ROI, for each DZD invested in the current
scenario, it gives 0.04 DZD. On the other hand, regarding the improved
scenario, it gives 0.17 DZD, more than 4 times. Again, there is a reduction in
the unit cost, which shows that the changes are profitable. The next Figure 8
provides an overview of all changes in production costs and the farmer's
margin.
comparison of potato production costs and profit margin
(DZD)
|
Improved Potato
Current Potato
|
|
|
|
|
0 200000 400000 600000 800000 1000000 1200000 1400000 1600000
Seeds Fertilizer other costs Post Harvest cost Labor cost
Margin
Figure 8 Overview of production costs and profit
margin
Source: GIZ/ FBS Potato. 2020. Module 5

This analysis was for the primary product, the following is
the same analysis for the secondary products in a shortened form. The following
table shows the performance analysis of onion production in the current
scenario and the improved one.
Table 3 Onion Comparative production Analysis
|
Input
|
Unity
|
Current Scenario
|
Improved Scenario
|
Change
|
|
Quan-
tity
(kg)
|
Price
(DZD)
|
Total (DZD)
|
Quan-
tity
|
Price
(DZD)
|
Total
(DZD)
|
%
|
|
Input
|
|
Input Cost
|
DZD
|
520,000
|
611,100
|
+17.5%
|
|
Labor
|
Man- day
|
95
|
1,500
|
142,500
|
101
|
1,500
|
151,500
|
+6 Man-day
|
|
Total Varia- ble Cost
|
|
663,100
|
762,600
|
+15%
|
|
Output
|
|
Gross Revenue
|
DZD
|
50,000
|
20
|
1,000,000
|
70,000
|
21
|
1,470,000
|
Yield: +40% Price: +5% Rev-
enue: +47%
|
|
Gross Mar- gin
|
DZD
|
336,900
|
707,400
|
+110%
|
|
ROI
|
(%)
|
50%
|
92%
|
+42%
|
|
Unit Cost
|
DZD
|
13.26
|
10.89
|
-18%
|
Source: GIZ/ FBS Potato. 2020. Module 5
For onion production, table 3 shows a 17.5% increase in input
costs and a 6.3% increase in labor costs. Following these changes in
production, a remarkable increase in gross margin of 47% in the improved
scenario is observed. Thus, an increase in labor (6 man-day). Moreover, one DZD
invested in this production gives 0.5 DZD in the current scenario and 0.92 DZD
in the improved scenario. Likewise, the unit cost evolution shows a notable
reduction from 13.26 DZD in the current scenario to 10.89 DZD in the improved
scenario. The next Figure 9 provides an overview of all changes in production
costs and the farmer's margin.
24|

comparison of Onion production costs and profit margin (DZD)
|
Improved Onion
Current Onion
|
|
|
0 200000 400000 600000 800000 1000000 1200000 1400000 1600000
Input costs and service Labor Cost Margin
25|
Figure 9 comparison of onion production costs and profit
margin
Source: GIZ/ FBS Potato. 2020. Module 5
Table 4 Peanut production Comparative Analysis
|
Input
|
Unity
|
Current Scenario
|
Improved Scenario
|
Change
|
|
Quantity
(kg)
|
Price
(DZD)
|
Total
(DZD)
|
Quantity
|
Price
(DZD)
|
Total
(DZD)
|
%
|
|
Input
|
|
Input Cost
|
DZD
|
168,200
|
257,600
|
+53%
|
|
Labor
|
Man-day
|
47
|
1,500
|
70,500
|
47
|
1,500
|
70,500
|
No change
|
|
Total Variable Cost
|
|
238,700
|
328,100
|
+37%
|
|
Output
|
|
Gross Revenue
|
DZD
|
1,000
|
260
|
260,000
|
3,000
|
260
|
780,000
|
+200%
|
|
Gross Margin
|
DZD
|
21,300
|
451,900
|
+2022%
|
|
ROI
|
(%)
|
8.9%
|
137%
|
+128.1%
|
|
Unit Cost
|
DZD
|
238.7
|
109.37
|
-54%
|
Source: GIZ/ FBS Potato. 2020. Module 5
For Peanut production, table 4 shows a 37% increase in input
costs and 200% increase in peanut production. Following these changes, a
remarkable increase in gross margin +430.600 DZD in the improved scenario is
observed. Besides, one DZD invested in this production gives 0.089 DZD in the
current scenario and 1,37 DZD in the improved scenario. Likewise, the unit cost
evolution shows a notable reduction from 238,7 DZD in the current scenario to
109,37 DZD in the improved scenario. The next Figure 10 provides an overview of
all changes in production costs and the farmer's margin.

comparison of peanut production costs and profit margin (DZD)
Improved Peanut

0 200000 400000 600000 800000 1000000 1200000
Input costs and service Labor Cost Margin
26|
Figure 10 comparison of peanut production costs and profit
margin
Source: GIZ/ FBS Potato. 2020. Module 5
Finally, to get a global overview and based on the different
performance criteria, the following figure 11 summarizes the evolution of the
parameters GM, ROI and UC of the 3 agricultural activities (Potato, onion,
peanut).
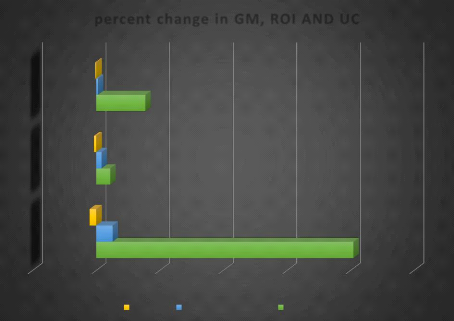
-500% 0% 500% 1000% 1500% 2000% 2500%
Peanut
Potato
Onion
-54%
-18%
-8%
percent change in GM, ROI AND UC
13%
42%
110%
128%
Unit cost Return on Investment Gross Margin
387%
2022%
Figure 11 Summary percent change of the 3 activities
Source: GIZ/ FBS Potato. 2020. Module 5

27|
Figure 11 shows that the evolution of the GM, UC and the ROI
in the improved scenario are mostly very important for the secondary products
than for the main product, This may look contradictory, but this is explained
by the advantage of potato production, for example, having 3 harvests
throughout the year, the importance of this product in the eating habits of
Algerians and the remarkable increase in its consumption in recent years, in
addition to the orientation of industrial operators to engage in transformation
and the start of exporting this product to Russia. As a consequence, and due to
the state policy aimed at the development of the agricultural land, the
cultivated potato land has increased from 300 ha in 1993 to 33,000 ha in 2000
and the number of potato producers has increased from 800 to 5,000 between 2000
and 2014. This can largely confirm the choice of potatoes as the main product.
(Chambre d'agriculture Algeria, 2014).
To get an idea on the distribution of the gains concluded from
the three activities and the improvement of the incomes. The chart in Figure 11
shows the composition of the smallholder farmer's income in the two scenarios
and shows how many times the income has increased.

Total Revenue: 399,700 DZD Total Revenue: 1,361,400
DZD
Current Scenario Improved Scenario
Peanut
5%
Onion
84%
Potato
11%
Peanut
33%
Potato
15%
Onion
52%
Figure 12 share of total output Value
Source: GIZ/ FBS Potato. 2020. Module 5.
Figure 12 highlights the profit composition of the 3 crops in
both scenarios. The total income from agricultural production increased more
than three times. As far as income distribution is concerned, a great disparity
of income between the 3 products in the

28|
current scenario is noticed, but in the improved scenario, the
distribution is more equitable. This is of great importance to practice this
crop rotation system with a stable income with potato and Peanut in the first
year and onion in the following year.
This last budgeting analysis is valid only at a certain time
interval, any change in price and cost of production can directly influence the
market and the introduction of a new technology such as the irrigation pivot by
the farmer which can also cause changes in costs and prices.
It would be better to anticipate future changes and make a
risk analysis and determine the influence of a price change on the gross margin
in both scenarios. In this study more importance is given to the main product,
the potato, and one of the most significant parameters, which has a great
effect on the budget which is the price of potatoes. Already there is a large
fluctuation of potato wholesale prices in Algeria, which alternates between 33
and 45 DZD per Kg. As a result, a simple equation of this parameter (potato
price) can be established.
Gross Margin/plot = Gross revenue/plot - Variable cost/plot,
GM= TR - CV = (Yield/plot) x (Price/kg) - VC = Y pp - VC
For the current scenario, the equation is: GM= 30,000 pp -
948,500
For the Improved Scenario, the equation is: GM= 40,000 pp -
1,157,900
Potato Gross Margin
700000
|
GM (DZD)
|
600000 500000 400000 300000 200000 100000
0
|

642100
402100
221500
162100
41500
401500
33 DZD 39 DZD 45 DZD
Potato Price
Current Scenario Improved Scenario
Figure 13 Potato Gross Margin evolution for both
scenario
Source: GIZ/ FBS Potato. 2020. Module 5

29|
Figure 13 highlights the effect of changing potato prices on
GM. In fact, the increase in potato prices has a very important impact, which
highlights the importance of investing in potato storage, or else, smallholders
should get updates on the prices each week. Then, they could decide how many
batches they produce, the quantity of each batch and the time of planting,
harvest and selling.
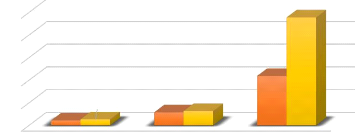
Concerning the unit cost and after moving to the improved
scenario, an important reduction of the cost of production for the 3 crops is
noticed as shown in the following histogram (Figure 14). This allows farmers to
increase their competitiveness.
Unit Cost (DZD) per Kg
250
200
150
100
50
0
10.89
13.26 28.95 31.62
109.37
238.7
Onion Potato Penaut
Improved Scenario Current Scenario
Figure 14 Unit cost evolution for both scenario
Source: GIZ/ FBS Potato. 2020. Module 5
Through the results found above, the productivity of capital
and labor productivity can be deduced as shown in the following table 5.
Table 5 comparison of Labor productivity & Capital
productivity
|
Crop
|
Potato
|
Onion
|
Peanut
|
|
Labor productivity = (Revenue - Input Cost) /
Labor
|
+1,377
|
+3,457
|
+ 9,161
|
|
number used
|
(+72%)
|
(+68%)
|
(+470%)
|
|
Additional Labor for one mini-pivot (man-day)
|
9
|
6
|
0
|
|
Capital productivity= Gross Margin /Variable
cost
|
+0,13
|
+0,42
|
+1,29
|
Source: GIZ/ Potato Spreadsheet. 2020
The comparison of capital and labor productivity shows a large
increase in the improved scenario as a result of a good allocation of
production resources. This large

30|
gap between the two values as shown in Table 5 shows how
absolute effective the improved scenario is. This productivity is increased
thanks to the introduction of high-performance innovations, efficient work,
training of the labor in new techniques and almost importantly by improving the
production process and adopting GAP.
At this level, this type of last analysis, budgeting and the
variable costs considered indicate to retain the necessary adjustments in
production costs to increase profitability and also to highlight the direct
impact of the GAP application, the improvement of technical, managerial and
thus economic skills. It is all a complex process and with the adjustment of
these parameters together, the profitability of the farm can be greatly
increased. Moreover, additional employment has been realized after adopting
GAP.
With regard to job creation, Ould Rebai et al. (2017, p.7) has
enumerated from a sample of farmers surveyed, which distinguishes three types
of investors, who specialize in potato production using the new mini-pivot
technology. These are large investors, small investors and cultivators). The
table 6 shows the number of pivots used for each category during a potato and
Onion production campaign and then deduced the number of additional jobs
created. (Production lasts two years)
Table 6 Additionall job created using GAP
|
Type of Farm- ers
|
Number of mini
Pivot
|
Additional jobs created (man-days)
|
Total addi-
tional jobs
|
|
Potato
|
Onion
|
|
large investors
|
12
|
9
|
6
|
180 man-days
|
|
small investors
|
6
|
9
|
6
|
90 man-days
|
|
cultivator
|
2
|
9
|
6
|
30 man-days
|
Source: ould Rebai. 2017. An incremental innovation: design
and diffusion of an artisanal center pivot for irrigationin the Souf (Algerian
Sahara).
The number of jobs created varies between 30 and 180 man-days
depending on the type of investor. This shows only the direct employment after
the adoption GAP. Other indirect employment could be proclaimed, such as
maintenance services, all the trainer from the training centers, who work in
the mini-pivot production chain, the supply companies and importers of parts
necessary to produce mini-pivot. This technology (mini-pivot Irrigation) has
created a dynamic in the region starting with the return of investors,
providing income to the local population, employing young people (majority of
small investors, Table 6) and opening agro-supply businesses.

31|
| 

