3.5 Methodological Approach
Prior to the analysis, the consultants prepared the collected
Data in Excel, covering the economic calculations for each of the agricultural
products in both the current and improved cases.
For the analysis methods, Ishikawa Cause and Effect Diagram
and a Comparative analysis, are going to be used in order to highlight the
efficiency of the given solutions.
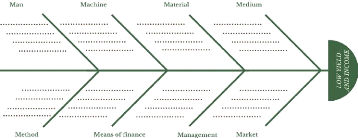
To begin with, the Ishikawa Cause and Effect Diagram is a
problem-solving tool for the farm business. This tool in the form of
fish-shaped diagram (figure 5), suitable for monitoring the production
techniques, farm management and economic skills. To construct this diagram,
there are 8 main sections to identify the risks that could cause a problem at
the farm level:
· Man: collaborators and actors in a farm like the farmer
and his/ her workers
· Machine: means of production and the equipment used in
agricultural enterprises
· Material: components that go into the development of
the final product like seeds and fertilizer.
· Medium: Risks in a farm environment
· Method: the techniques, procedures, or operating
modes
· Means of finance: Available financial services
· Management: strategic and Administrative management of
operations
· Market: Obtaining market information and planning
sales

15|
Figure 5 Ichikawa Diagram (Ishikawa 1990)
For the comparative analysis, 5 performance criteria relevant
for analysis and planning at the farm level were assessed. These 5 criteria
are: Productivity, Profitability, Stability, Diversity and Sustainability.
First of all, Productivity is the parameter of suitability of
the activity in an agricultural environment and an indicator of resource which
use efficiency and performance management. This was interpreted showing the
effect of adopting GAP on crop yields and measure the increase on
Production.
Second, concerning Profitability, tables deducting the change
of Input Quantity, prices and Gross Margin in both cases have been established.
These Tables show the impact over time of improvement management and production
techniques on profit.
Thus, the choice of the main product of the training was
explained and was determined if this product was the one with the highest
profit. Furthermore, the return per euro invested, the unit cost, labor
productivity and capital productivity have been calculated and interpreted.
Third, stability, which is the absence of fluctuations in
product cost (labor unit and Input cost), yield and product price from one year
to another. Stability of both scenarios is evaluated by measuring the
coefficient of variation.
Forth, diversification, and to evaluate this parameter
(diversity), the Simpson's Diversity index (DI) is an appropriate method to
express the level of household income diversity. Finally, the depreciation of
the Mini-pivot, the Farm Net Actual Returns and the Farm Net Sustainable
Returns were Calculated. Then, the Household Revenue per day and per member is
determined, in order to evaluate the place of smallholder farmers' incomes in
relation to the poverty line.

16|
4 Result Analysis
| 

