ANNEXES
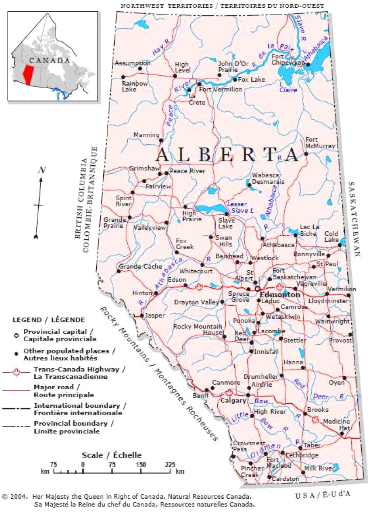
Annexe 1 : Carte de l'Alberta. Source : Ressources
naturelles ada.
Can

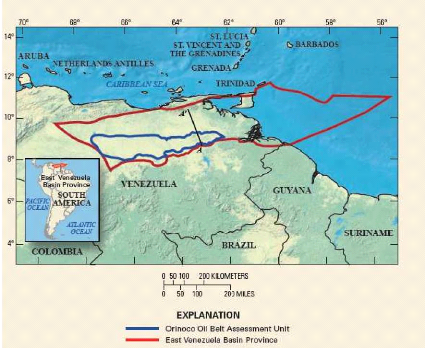
Annexe 2: Carte du Venezuela et localisation des
gisements d'huiles extra lourdes dans le bassin du fleuve Orénoque.
Source : U.S. Geological Survey, 2009.

Annexe 3 : Prix mensuels du pétrole
léger/moyen et lourd et du bitume pour l'année 2010. Source :
ERCB.

Energy Resources Conservation Board
ST-3: Alberta Energy Resources Industries Monthly
Statistics Table - Oil Prices - 2010
$ per cubic metre
Crude Oil - Heavy
Crude Oil - Light & Medium Crude Bitumen
|
|
|
|
|
|
|
|
|
|
|
|
Year to Date
|
|
Jan
|
Feb
|
Mar
|
Apr
|
May
|
Jun
|
Jul
|
Aug
|
Sep
|
Oct
|
Nov
|
Dec
|
2010
|
|
$426.52
|
$420.03
|
$432.40
|
$0.00
|
$0.00
|
$0.00
|
$0.00
|
$0.00
|
$0.00
|
$0.00
|
$0.00
|
$0.00
|
$426.32
|
|
$481.07
|
$488.16
|
$498.19
|
$0.00
|
$0.00
|
$0.00
|
$0.00
|
$0.00
|
$0.00
|
$0.00
|
$0.00
|
$0.00
|
$489.14
|
|
$405.02
|
$395.79
|
$401.14
|
$0.00
|
$0.00
|
$0.00
|
$0.00
|
$0.00
|
$0.00
|
$0.00
|
$0.00
|
$0.00
|
$401.14
|
Annexe 4 : Production et volumes à disposition de
pétrole brut, en Alberta, en 2010. Source : ERCB.
|
Supply and Disposition of Crude Oil and
Equivalent
Unit = m3
|
|
Run Date:April 26, 2010
|
|
|
Supply
|
|
Jan
|
Feb
|
Mar Apr May
|
|
|
|
|
|
Opening Inventory
|
|
10'856'368.5
|
10'912'551.9
|
11'270'816.1
|
|
Production
|
|
|
|
|
|
Crude Oil Heavy
|
679'377.3
|
623'724.8
|
692'044.0
|
|
Crude Light & Medium
|
1'535'454.0
|
1'427'440.4
|
1'596'177.9
|
|
Crude Bitumen
|
3'237'420.1
|
3'179'465.7
|
3'573'149.3
|
|
Condensate
|
65'044.2
|
58'367.7
|
65'250.7
|
|
Total Production
|
5'517'295.6
|
5'288'998.6
|
5'926'621.9
|
|
Oil Sands Plant Process
|
|
|
|
|
|
Synthetic Crude
|
2'873'144.0
|
3'207'073.6
|
3'501'310.3
|
|
Plant/Gathering Process
|
|
|
|
|
|
Pentanes Plus
|
388'304.9
|
349'237.9
|
390'220.8
|
|
Fractionation Yield
|
|
|
|
|
|
Pentanes Plus
|
180'185.8
|
166'597.3
|
189'945.1
|
|
Skim Oil
|
|
8'276.3
|
8'226.0
|
8'722.6
|
|
Imports
|
|
1'435'990.4
|
1'336'652.4
|
1'519'171.5
|
|
Close Inventory
|
|
10'912'551.9
|
11'270'816.1
|
11'391'770.0
|
|
Total Supply
|
|
|
|
|
|
10'347'013.6
|
9'998'521.6
|
11'415'038.3
|
|
Disposition
|
|
|
|
|
|
Alberta Refinery Sales
|
|
1'947'756.4
|
1'852'218.4
|
1'918'481.9
|
|
Alberta Other Sales
|
|
202'115.0
|
294'003.7
|
331'864.9
|
|
Total Alberta
|
2'149'871.4
|
2'146'222.1
|
2'250'346.8
|
|
Other Canada
|
|
|
|
|
|
British Columbia
|
210'238.3
|
169'222.6
|
225'938.8
|
|
Saskatchewan
|
920'426.9
|
818'467.0
|
1'162'614.5
|
|
Manitoba
|
0.0
|
0.0
|
0.0
|
|
Ontario
|
704'669.6
|
525'382.5
|
595'092.9
|
|
Quebec
|
0.0
|
0.0
|
0.0
|
|
Maritimes
|
0.0
|
0.0
|
0.0
|
|
NWT & Yukon
|
0.0
|
0.0
|
0.0
|
|
Total Other Canada
|
1'835'334.8
|
1'513'072.1
|
1'983'646.2
|
|
USA
|
|
|
|
|
|
PAD1
|
184'696.3
|
91'010.3
|
128'680.4
|
|
PAD2
|
4'234'242.5
|
4'036'463.6
|
4'636'035.3
|
|
PAD3
|
0.0
|
0.0
|
0.0
|
|
PAD4
|
1'416'346.9
|
1'292'516.7
|
1'489'159.8
|
|
PAD5
|
499'312.3
|
610'965.1
|
588'923.0
|
|
Total USA
|
6'334'598.0
|
6'030'955.7
|
6'842'798.5
|
|
Offshore
|
|
96'975.9
|
402'500.4
|
166'153.0
|
|
Removed from the Province
|
|
8'266'908.7
|
7'946'528.2
|
8'992'597.7
|
|
Reporting Adjustment
|
|
-69'766.5
|
-94'228.7
|
172'093.8
|
|
Total Disposition
|
|
10'347'013.6
|
9'998'521.6
|
11'415'038.3
|
|
|
0.0
|
0.0
|
0.0
|
|
Reporting Adjustment %
|
|
0.67%
|
0.94%
|
1.51%
|
|
Note:
|
|
|
|
|
Please note that the volume of in situ bitumen upgraded
to synthetic crude oil (SCO) has been removed from
the Production Crude Bitumen category, and the
corresponding volume of SCO is reported in the Oil Sands Process Synthetic
Crude category.
| 


