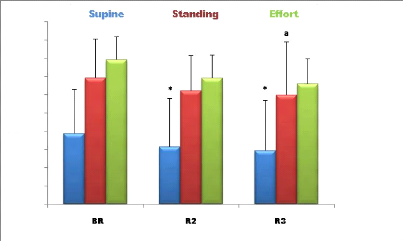
III.1. Effect of Ramadan fasting on the sympathetic
system III.1.1. LF (ms2)

LF (ms2)
400
600 Supine Standing Effort
P.cou P.debou P.l'effo
500
300
200
100
0
*
a
b
*
a
b
Figure 3: Mean (#177; SD) LF (ms2)
values recorded during the second, fourth week and before Ramadan (n = 9).
* (p <0.05) Significant difference from before Ramadan
(supine position);
a (p <0.05) Significant difference from before Ramadan
(standing position); b (p <0.05) Significant difference from before Ramadan
(During effort).
· Supine position: the analysis of the variance
shows a significant effect F (2) = 12.67; p <0.05 Ramadan fasting on the
mean values LF (ms2) (Figure 3).
The post hoc analysis shows that the LF values recorded
before Ramadan are significantly higher than those measured in the middle and
at the end of the month of fasting P <0.05.
· Standing position: The analysis of the variance
shows a significant effect F (2) = 12.22, p <0.05 Ramadan fasting on the
mean values LF (ms2) (Figure 3).
The post hoc analysis shows that the LF values recorded
before Ramadan, when standing, are significantly higher than those measured in
the middle and at the end of the month of fasting p <0.05.
· 40
During effort: The analysis of the variance shows a
significant effect F (2) = 11,52; p <0.05 Ramadan fasting on mean values LF
(ms2) after exercise (Figure 3).
The post hoc analysis shows that the LF values recorded before
Ramadan, during exercise, are significantly higher than those measured in the
middle and at the end of the month of fasting (P <0.05).
III.1.2. LF (nu)

LF (nu)
100
40
90
80
70
60
50
30
20
10
0
a b
b
Figure 4: Mean (#177; SD) LF (nu) values
recorded during the second, fourth week and before Ramadan (n = 9).
* (p <0.05) Significant difference compared to before Ramadan
(supine position); a (p <0.05) Significant difference compared to before
Ramadan (standing position); b (p <0.05) Significant difference compared to
before Ramadan (During effort).
· Supine position: The Analysis of the variance
shows a significant effect F (2) = 11.66; P <0.05 Ramadan fasting on mean
values LF (nu) (Figure 4).
The post hoc analysis shows that the LF values recorded
before Ramadan, in supine position are significantly higher than those measured
in the middle and at the end of Ramadan (P <0.05).
· Standing position: The analysis of the variance
shows a significant effect F (2) = 11,23; P <0.05 of Ramadan fasting on the
mean LF values (Figure 4).
41
The post hoc analysis shows that the LF values recorded before
Ramadan, while standing, are significantly higher than those measured in the
middle and at the end of the month of Ramadan (P <0.05).
· During effort: The analysis of the variance
shows a significant effect F (2) = 10.55; P <0.05 of Ramadan fasting on mean
values LF (nu) (Figure 4).
The post hoc analysis shows that the LF values recorded
before Ramadan, during the effort, are significantly higher than those measured
in the middle and at the end of the month of Ramadan (P <0.05).
| 


