4.6. GDP and economic
well-being
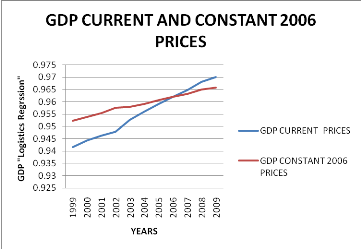
Data show that GDP current prices had increasingly increased
from 1999 to 2009, but even though there had been increasing in GDP Current
prices, GDP Constant 2006 Prices had declined from 2006 to 2009. This means
that there has been inflation regardless the increase in GDP current. The gap
between GDP current and constant right side cross section of those covers shows
how the inflation intensity from 2006 to 2009 was.

The following graph shows that GDP current prices will
continue to increase over GDP Constant 2006 Prices. This is view by making
projection in 10 Years beyond the period of the study. This mean that the GDP
Deflator will increase continually if anything is done to stop this disparity
in GDP Current and GDP Constant 2006 Prices. The gap between GDP current and
constant right side cross section of those covers shows how the inflation
intensity from 2006 will be in the following 10 years of projection.

GDP is at best an imperfect measure of economic well-being.
Among the factors affecting well being omitted by the real GDP are the
availability of leisure time, non-market services such as unpaid homemaking and
volunteer services, environmental quality and resource conservation, and
quality of life indicators such as low crime rate. The GDP also does not
reflect the degree of economic inequality in country; because real GDP is not
the same as economic well-being, proposed policy should not be evaluated
strictly in terms of whether or not they increase the GDP.
Although the GDP is not the same as economic well-being, it is
positively associated with many things that people value, better homes , better
life, better health, higher life expectancy, higher rate of literacy.
This relationship between real GDP and economic well-being
tend to evaluate economic development of Rwanda and this relationship has led
Rwanda to the improvement of their way of producing, saving and consuming,
health and education in search of better life and has motivated policymakers in
Rwanda to try to increase the rate of economic growth oriented to economic
development of Rwanda through out many strategic policies such as EDPRS,
RSSP.
4.7. Data interpretation
«SUT/I-O Tables and Economic Development of Rwanda»
Achieving the millennium development goals will require an
open, rule-based global economy in which all Rwandans rich and poor
participate.
Rwanda is in the middle of a major demographic transition. Its
population continues to grow every year, but the pace of growth has slowed as
fertility rates decline (Republic of Rwanda, NISR: Statistical Yearbook 2009
Edition, 2).
As Rwanda population growth slows, the age structure of Rwanda
population is changing, with the share of the youth declining and that of the
elderly growing. This changing in age structure has important implications for
economic and social policies and hence for sustainable economic development
(Republic of Rwanda, NISR: Statistical Yearbook 2009 Edition, 2).
4.7.1. Environment
Development and economic growth have improved the quality of
life for many people in Rwanda, but the gains have been uneven and economic
growth has often had negative environment consequences, with profound impact on
rural people.
Using environmental wisely is crucial for reducing poverty.
Many rural people in Rwanda depend on environment for their livelihoods.
Because rural people control far fewer natural and produced resources,
environmental degradation affects them disproportionately.
Environmental indicators in Rwanda which measure environmental
resources and goods and services produced from them, help to establish the link
between growth and environmental change and pointing the way towards
sustainable development.
| 


