3. Data and variables specification
Data were obtained from the National Institute of Statistics
of Cameroon2 and were resulting from the 2005 survey 1-2-3 which had
as objectives the follow-up of employment, informal sector and household
consumption. We used the phase 2 that focuses on the informal sector by
collecting data on the working conditions, manpower, contribution of the
informal sector to the economy and issues and perspectives of that sector. The
phase 2 is theoretically supposed to happen every four years. It will then be
possible to update the parameters of the model we are proposing according to
that periodicity.
As we mentioned above, the PCA was used for the variables
specification. 4,815 IUPs were involved in the process. The first two
axes were representing 58.5% of the total variability. When plotting
the IUPs according to these two axes, the results suggested that they were
relatively very close each other as shown on the graph 1 below. In
fact almost all IUPs are surrounding the mean point.
2
www.statistics-cameroon.org
Graph 1: Two way scatter of IUPs in the factorial plan
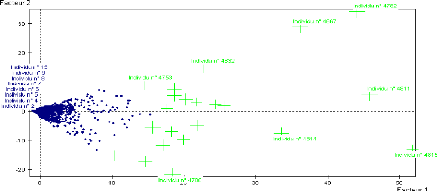
Nevertheless, some points are found very far from the mean
point suggesting that they are witnessing a relatively high level of activity
with sales cros sing the threshold of the FCFA 1,000,000 (US$ 2,500).
Theses points are represented by crosses proportional to the size of their
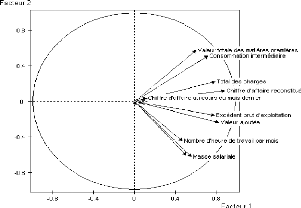
activities. Variables were also represented in the correlation circle (see
graph 2). This graph shows that almost the whole variables are very well
represented, the arrows designating each being very close to the borders of the
circle on the factorial plan. We can observe four groups of variables. The
first is the set raw materials and intermediary consumption, the
second, number of worked hours and the salaries, the third,
variables indicating the gross benefice and the fourth, sales and
costs.
Graph 2: Variables correlation in the factorial plan
We will finally keep only three variables representing each
group: the sales, the number of hours worked and the costs per month. To these
variables we will add control variables like education level of the owner, his
age and the age of the IUP.
4. Findings and Results
The dynamic of job creation in
Cameroon
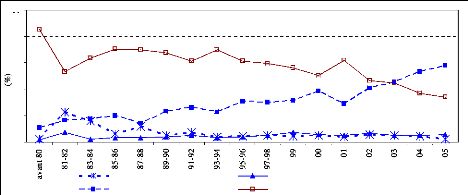
From the curves below, we can notice that the informal
non-farming sector (60%) has become since 2003 the main occupation of the
population, crossing over the farming informal sector (38%). The public and the
private formal sectors are stagnating since the 90s.
Graph 3: Job creation according to the institutional sector over
20 years
Source: NIS, Surveys 1-2-3, 2005, Phase 1
100
40
60
20
80
0
Secteur public Entreprise privée formelle
Entreprise privée informelle non agricole Entreprise
informel agricole
Structure of employment in Cameroon
Table 1: Structure of employment according to institutional
sector and the area
|
Employment
%
|
Mean age
|
Females (%)
|
Male (%)
|
Years of
di
|
Experience within h i
|
|
Urban
|
|
|
|
|
|
|
|
Public
|
10.5
|
39.7
|
31.8
|
81.1
|
12.3
|
9.6
|
|
Private formal
|
11.8
|
36.1
|
20.4
|
79.1
|
10.9
|
5.9
|
|
Informal non-farming
|
67.4
|
31.2
|
45.4
|
66.4
|
7.0
|
4.5
|
|
Informal farming
|
10.3
|
37.2
|
57.4
|
52.0
|
5.2
|
12.6
|
|
Overall
|
100
|
33.3
|
42.2
|
67.9
|
7.8
|
6.0
|
|
Rural
|
|
|
|
|
|
|
|
Public
|
2.6
|
39.4
|
25.8
|
79.7
|
11.3
|
7.5
|
|
Private formal
|
2.0
|
35.9
|
15.4
|
79.3
|
7.6
|
6.7
|
|
Informal non-farming
|
22.5
|
31.9
|
55.0
|
44.3
|
4.3
|
6.2
|
|
Informal farming
|
72.9
|
33.3
|
52.7
|
35.3
|
3.2
|
12.2
|
|
Overall
|
100
|
33.2
|
51.8
|
39.3
|
3.8
|
10.6
|
|
Cameroon
|
|
|
|
|
|
|
|
Public
|
4.9
|
39.6
|
29.5
|
80.6
|
11.9
|
8.8
|
|
Private formal
|
4.7
|
36.0
|
18.9
|
79.1
|
9.9
|
6.2
|
|
Informal non-farming
|
35.2
|
31.5
|
49.8
|
56.3
|
5.8
|
5.3
|
|
Informal farming
|
55.2
|
33.5
|
53.0
|
36.2
|
3.4
|
12.2
|
|
Overall
|
100
|
33.2
|
49.1
|
47.4
|
4.9
|
9.3
|
Source: NIS, Surveys 1-2-3, 2005, Phase
1
Table 1 shows that across the country, more than one
worker out of two is a business owner
working as a self-employer or with
very few employees. In the rural area, almost one third of
the working population is family helping without effective
salaries. The working class which is the more representative in developed
countries accounts only for 8% in the whole country and 20.3% in urban area.
Not surprisingly, the formality of positions goes side by side with the number
of years of schooling.
Underemployment in Cameroon
Visible underemployment is a situation characterizing workers
unwillingly involved in less than 35 hours a week in their main activity for
reasons linked to their employer or to a bad economic situation. It was
touching 12.2% of the working class in Cameroon in 2005. It is twice higher in
the non-farming working sector than in all other sectors. It increases
according to the level of education. A high working time could be also
translated by a form of underemployment occasioned by the lowness of the
productivity. This form of underemployment is called invisible underemployment
and is usually estimated by the level of income. In Cameroon, the invisible
underemployment rate is defined as the percentage of the working class earning
less than FCFA 23,500 (US$ 65) a month for 40 hours worked a week. This rate is
estimated at 69.3% of the actual manpower. It is within the informal sector
that underemployment is more crucial with more than six persons out of 10. The
underemployment affects more the rural area than the urban area. In the
contrary of visible underemployment, invisible underemployment decreases with
the level of education. The sum of these two forms of underemployment and the
unemployment yields the global underemployment that touches three quarters of
the potential working class in Cameroon. This problem is the more critical of
the Cameroon employment issues because many trained young people declare
exercising informal jobs to survive while hoping for a more stable and better
rated job corresponding to their qualification and/or their level of
studies.
Table 2: Rates of underemployment according to institutional
sector, the gender and the area
|
Institutional sectors
|
|
Visible
|
|
|
Invisible
|
|
Overall
|
|
|
Urban
|
Rural
|
Cameroon
|
Urban
|
Rural
|
Cameroon
|
Urban
|
Rural
|
Cameroon
|
|
|
|
|
|
|
|
|
|
|
Public
|
7.3
|
10.1
|
8.4
|
3.1
|
17.4
|
8.6
|
10.3
|
26.8
|
16.7
|
|
Private formal
|
6.4
|
5.6
|
6.2
|
13.6
|
31.8
|
19.0
|
19.3
|
34.2
|
23.7
|
|
Informal non-farming
|
17.1
|
23.1
|
19.9
|
54.4
|
66.8
|
60.1
|
64.8
|
77.5
|
70.6
|
|
Informal farming
|
15.6
|
7.6
|
8.0
|
70.2
|
85.7
|
84.8
|
75.1
|
87.5
|
86.8
|
|
Gender
|
|
|
|
|
|
|
|
|
|
|
Male
|
12.1
|
11.8
|
11.9
|
37.8
|
71.5
|
60.7
|
50.9
|
77.2
|
68.3
|
|
Female
|
18.2
|
10.5
|
12.4
|
56.6
|
85.2
|
78.2
|
70.9
|
88.3
|
83.6
|
|
Overall
|
14.7
|
11.1
|
12.1
|
45.7
|
78.6
|
69.3
|
68.3
|
83.6
|
75.8
|
Source: NIS, Surveys 1-2-3, 2005, Phase
1
Effectiveness of IUPs
The effectiveness of an IUP corresponds to its ability to
create jobs in order to raise its production and make profits. The level of
gross profit has therefore been considered in this paper to categorize IUPs.
Meanwhile, table 3 below shows other possible criterions that we could
have taken. The nationwide gross profit median is FCFA 28,000 (US$70)
per month; a very low profit which mainly characterizes IUPs in Cameroon. But
this median profit is stretched from a minimum of FCFA 82,000
(US$165) losses to a maximum of FCFA
8,899,000 (US$18,000) earnings with a standard
deviation of FCFA 199,429 (US$400). We can also notice that those with
employees are the more performing. A qualitative criterion could be settled on
that aspect if credits have to be attributed to IUPs.
Table 3: Performances of IUPs per type of occupation and per
type of area (monthly in ,000 FCFA)
|
|
Sales
|
Production
|
Added value
|
Gross profit
|
|
Mean
|
Median
|
Mean
|
Median
|
Mean
|
Median
|
Mean
|
Median
|
|
Type of occupation
|
|
|
|
|
|
|
|
|
|
Self employment
|
133.8
|
47
|
77
|
36
|
43.7
|
19
|
43
|
19
|
|
Non salary job
|
173
|
65
|
110.9
|
46
|
58.2
|
22
|
54.7
|
21
|
|
Salary job
|
704.3
|
300
|
529.9
|
200
|
328.3
|
122
|
254.3
|
85
|
|
Mixt
|
650.6
|
255
|
601.9
|
255
|
304.8
|
171
|
226.7
|
112
|
|
Overall
|
173.8
|
57
|
110.2
|
41
|
62.4
|
28
|
57
|
28
|
|
Urban area
|
|
|
|
|
|
|
|
|
|
Self employment
|
206.5
|
90
|
112.3
|
56
|
66.9
|
34
|
65.6
|
32
|
|
Non salary job
|
283.3
|
117
|
187.2
|
84
|
96.5
|
44
|
89.9
|
38
|
|
Salary job
|
897.1
|
301
|
625
|
280
|
360.7
|
172
|
274.1
|
112
|
|
Mixt
|
683.7
|
311
|
643.7
|
311
|
326.9
|
197
|
241.1
|
120
|
|
Overall
|
275.2
|
105
|
168.3
|
69
|
95.5
|
41
|
86.5
|
37
|
|
Rural area
|
|
|
|
|
|
|
|
|
|
Self employment
|
83.2
|
31
|
52.4
|
26
|
27.6
|
12
|
27.2
|
12
|
|
Non salary job
|
109.1
|
45
|
68.9
|
37
|
37.2
|
16
|
35.3
|
15
|
|
Salary job
|
463.5
|
200
|
411.2
|
150
|
287.8
|
100
|
229.5
|
61
|
|
Mixt
|
504.3
|
113
|
445.9
|
113
|
222.5
|
69
|
172.7
|
41
|
|
Overall
|
104.6
|
37
|
70.5
|
30
|
39.8
|
14
|
36.9
|
13
|
Source: NIS, Surveys 1-2-3, 2005, Phase
2
Table 4 displays some of the characteristics of the
two groups generated. The more effective group is in almost all aspects
averagely greater than the less effective except in terms of age of the owner
and duration of exploitation where we could not find significant
disparities.
Table 4: Group's statistics (means)
Hours worked Education Age of the duration of
last month level Sales Costs owner exploitation
|
Less effective IUPs
|
136.6
|
5.0
|
44.0
|
33.0
|
36.6
|
6.6
|
|
More effective IUPs
|
210.5
|
7.7
|
384.7
|
263.9
|
35.4
|
6.2
|
|
Overall
|
173.6
|
6.4
|
214.7
|
148.6
|
36.0
|
6.4
|
Logistic analysis
The parameters of the logistic regression are shown on
table 5. The second column provides the estimated coefficients; the
fourth one displays the probability of rejecting the nullity of the
coefficients; and the last one shows the marginal effects of every variable.
Sales, hours spent at work, costs and to a lesser extent, education levels are
all significant at a threshold of 5%. As expected, costs affect negatively the
effectiveness of IUPs; this should be interpreted cautiously though, because
great expenses sometimes mean higher production for higher sales and higher
profits. This means also that the Government can effectively alleviate (0.24)
the informal sector by reducing or canceling some of their taxes to favor their
entrance into formality. The variable that influences the most is the amount of
sales with an odd ratio of 0.25. The time spent at work is almost neutral in
terms of impact on the effectiveness. As we can notice from the last column,
marginal effects are very low for all the variables at stake.
Table 5: Parameters of the logistic regression of the
effectiveness of IUPs
S.E Wald Signif. Exp ( ) Marg. Eff.


Education level
|
0.03
|
0.01
|
5.44
|
0.02
|
1.03
|
1. 12 x 10-6
|
|
Sales
|
0.25
|
0.01
|
646.58
|
0.00
|
1.28
|
8. 34 x 10-6
|
|
Charges
|
-0.24
|
0.01
|
618.23
|
0.00
|
0.79
|
-8. 14 x 10-6
|
|
# hours at work during last month
|
0.00
|
0.00
|
42.16
|
0.00
|
1.00
|
1. 60 x 10-7
|
|
Intercept
|
-7.85
|
0.32
|
617.26
|
0.00
|
0.00
|
---
|
Number of observations = 4809 ; Prob > chi2 = 0.000; Log
likelihood = -5 17.70446; Pseudo R2 = 0.8447
Table 6 below shows that 96.9% of the IUPs have been
well ranked from the logistic regression while only 72.3% were so with the
Wilks' test approach.
|
Table 6: Confusion matrix
|
|
|
|
|
Attributed groups
Real Groups
|
Less effective IUPs
|
More effective IUPs
|
Total
|
|
Less effective IUPs More effective IUPs
|
2,346 95
|
54
2,3 14
|
2,400
2,409
|
|
Total
|
2,441
|
2,368
|
4,809
|
We can therefore easily compute for any anonymous IUP the score
of effectiveness S;
S = 0.03Education + 0.25Sales - 0.24Costs,
and rank it according to it final score in order to efficiently
allocate them credit for their expansion to a formal activity.
| 

