III. RESULTS
SOCIO-DEMOGRAPHIC CHARACTERISTICS
OF PATIENTS
SEX OF PATIENTS
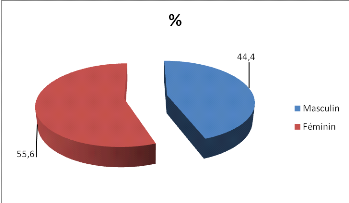
The sample in this study includes 160 patients' files, 89 of
which are women (55.6%) and 71 are men (44.4%) with a sex ratio M/W of 0.8 (see
figure 1).

Figure 1: Distribution of patients by gender
Figure 1 shows a slight feminine predominance
COMPARED DISTRIBUTION
BETWEEN AGE AND GENDER
The average age of our patients
was 44.7 #177; 12.3 years with extremes ranging from 16 to 79 years. The
youngest was 16 years old while the oldest was 79 years old.The table below
illustrates comparative representation by sex and age group.
Table I: Distribution of patients by age and sex
|
Age group
|
Gendre
|
Total
|
|
Male
|
Female
|
|
Number of patients
|
%
|
Number of patients
|
%
|
Number of patients
|
%
|
|
=30
|
3
|
4,2
|
5
|
5,6
|
8
|
5,0
|
|
31 - 40
|
26
|
36,6
|
29
|
32,6
|
55
|
34,4
|
|
41 - 50
|
19
|
26,8
|
36
|
40,4
|
55
|
34,4
|
|
51 - 60
|
11
|
15,5
|
11
|
12,4
|
22
|
13,8
|
|
61 - 70
|
10
|
14,1
|
7
|
7,9
|
17
|
10,6
|
|
=71
|
2
|
2,8
|
1
|
1,1
|
3
|
1,9
|
|
Total
|
71
|
100,0
|
89
|
100,0
|
160
|
100,0
|
This table indicates that age groups from 31 to 50 years were
the most represented (68.8%).
PROFESSION
The distribution by occupation indicated that there were
employees, unemployed persons and persons practicing the liberal profession
(see Table II).
Table II. Distribution of patients by profession
|
Profession
|
Number of patients
|
%
|
|
Household
|
57
|
35,6
|
|
Civil servants
|
44
|
27,5
|
|
Accountants
|
20
|
12,5
|
|
Tradespeople
|
15
|
9,4
|
|
Mechanics
|
14
|
8,8
|
|
Nurses
Other (student)
|
9
1
|
5,6
0,625
|
|
Total
|
160
|
100,0
|
The distribution by occupation indicates that housewives were
the most attacked by the disease.
| 


