3.2 Monetary and Exchange Rate Policy Management
3.2.1 Monetary Policy
Since the Central Bank of Rwanda assumed its primary
responsibility of formulation and implementation of monetary policy following
the Central bank law that gave the National Bank of Rwanda independence in
monetary policy, several instruments of monetary policy have been actively
applied to regulate liquidity in the economy. The monetary programming has
helped to guide the National Bank of Rwanda's conduct of its monetary policy to
ensure that liquidity expansion is consistent with target inflation and GDP
growth levels.
Monetary programming as a tool of the Central Bank of Rwanda
is characterized especially by the way it describes the monetary by an indirect
character. The objectives that have been set to conduct monetary policy are the
following:
- Final objective: control of inflation,
- Intermediate objective: monetary stock aggregate (M2)
because of the strong correlation between inflation and monetary stock,
- Operational objective: monetary base.
The frame of Central Bank's interventions in the indirect
character of monetary policy consists of:
- Projection of annual monetary balance,
- Forecast to be done on a monthly, quarterly and annual
basis,
- Weekly appreciation of the total level of the banking
liquidity by reference at the desired level of the monetary base.
The monetary instruments that have been used to conduct
monetary are among others:
- Monetary market, which was created in August 1997 as a
single framework for the allowance of the Central Bank currency and the
formation of interest rates through the levels of demand and supply. This
implies the interbank market interventions of Central Bank etc.
- Treasury bills market for monetary policy purposes or for
the needs of the government,
- Obligatory reserves as an instrument of banking liquidity
adjustment.
When the objectives and instruments to be used by the National
Bank of Rwanda are determined the next step to be specified in monetary
programming was focusing on the sources of the creation of currency or
counterparts of the money supply. The latter, as taken by the National Bank of
Rwanda, consists of Net External Assets (NEA) and Net Interior Assets (NIA)
(among others net credit to the private sector). Thus M2 can be expressed
as:
M2 = NEA + NIA
According to the above relation, the change of M2 will consist
of the change of the counterparts (predominance of NEA or NIA). On the other
hand, the regulation of the monetary base follows the counterparts of the
monetary base, which are mainly Central Bank Net External Assets and Central
Bank Net Interior Assets.
The policy of stabilization and economic reforms after the war
period aimed at the re-establishment of fundamental balances. In 1997, as in
previous years, the Central Bank of Rwanda with the Ministry of Economy and
Finance defined an annual inflation target of 7% by the end of 1997. During
1998 and 2000 the inflation was set at below 5%. However, after the
modifications made to the economic program under PRGF (from 1999 to the
present) inflation has been set at 3%. In addition, the GDP growth rate has
been set at 12.7% in 1997; 7% in 1998 and at 6% in 1999 to 2003 in the context
of PRGF.
The macroeconomic objectives undertaken during those years
were oriented towards restoring fundamental economic balances in order to allow
sustainable development. During that period, inflation came down from 11.7% in
1997 to -2.42% in 1999. Nevertheless, as shown in figure3-1, due to the great
inflationary uncertainty associated with the fact that the prices of food
products in Rwanda are often unstable due to the change of climatic conditions
(the drought in some areas) the annual targets for 1997 and 1998 were not
reached. However in 1999 and 2002 inflation was below the proposed target.
TABLE 3-1: INFLATION OBJECTIVE AND INFLATION OBSERVED IN
PERCENTAGE
|
Years
|
Inflation Objective (%)
|
Observed Inflation (%)
|
|
1997
1998
1999
2000
2001
2002
|
7
5
3
3
3
3
|
12.1
6.22
-2.42
3.91
3.36
1.98
|
(Source: IMF and Rwanda, 1995-2002)
The monetary programme in Rwanda follows the change in
monetary stock (M2) as an indicator of inflation. The relationship between the
growth of the aggregate M2 and inflation in 1997-2003 periods can be shown in
the figure 3.1 below:
FIGURE 3-1: ANNUAL GROWTH OF AGGREGATE M2 AND INFLATION:
1997-2002
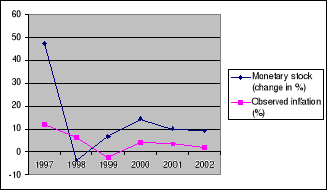
Table 3-2 shows the change in inflation and monetary stock. It
can be seen that the change in M2 depends on how is the predominance in the
change for NEA or NIA.
TABLE 3-2: MONETARY STOCK (M2), NET EXTERNAL ASSET (NEA) AND
NET INTERIOR ASSET (NIA) IN PERCENTAGE
|
Years
|
Monetary stock (M2)
|
Net External Asset
|
Net Interior Asset
|
|
1997
1998
1999
2000
2001
|
47.5
-3.9
6.6
14.4
10.1
|
22.6
4.55
-7.05
49.33
21.076
|
77.14
-10.93
20.32
12.207
12.207
|
(Source: Banque Nationale du Rwanda, 2002)
| 

