Annexe 2: Représentations graphiques des niveaux
de participation
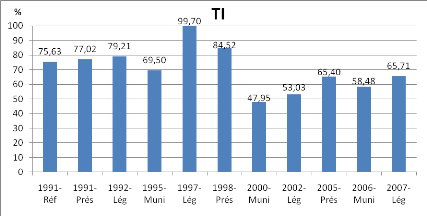
1-Graphique des inscriptions sur les listes
électorales
2-Graphique de la participation des inscrits
100 90 80 70
60 50 40 30 20
10 0
%
|
|
|
|
|
69,61 66,02
|
|
TP
56,09 56,73
|
|
44,53
|
|
35,24
|
|
25,12
|
|
|
48,65
|
60,69 57,66
49,12
|
1991-
Réf
1991-
Prés
1992-
Lég
1995-
Muni
1997-
Lég
1998-
Prés
2000-
Muni
2002-
Lég
2005-
Prés
2006-
Muni
2007-
Lég
viii
3-Graphique de la participation réelle au Burkina Faso.
% TPR
1 0 0
9 0
7 0
6 0
3 1 ,6 5 3 2 ,1 9
3 7 ,7 1
3 7 ,2 7
3 6 ,8 9
1 9 9 1 -
Ré f
1991-
Prés
1 9 9 2 -
L é g
1 9 9 5 -
M uni
1 9 9 7 -
L é g
1998-
Prés
2 0 0 0 -
M uni
2 0 0 2 -
L é g
2005-
Prés
2006-
Muni
2 0 0 7 -
L é g
4 0
3 0
2 0
1 0
0
1 9 ,3 0
2 7 ,9 1
2 8 ,6 9
8 0

1991-
1992-
1995-
1997-
2000-
2002-
2006-
2007-
Réf
Lég
Lég
Lég
Lég
Muni
Muni
Muni
1991-
Prés
1998-
Prés
2005-
Prés
5 0
4 8 ,3 8 4 4 ,4 0 4 7 ,3 9
TI TP TPR
%
100
90
80
70
60
50
40
30
20
10
0
4-Synthèse des graphiques de la participation
électorale sous la quatrième république
| 

