1. DEVELOPMENT ENVIRONMENT
For climate data, a framework to handle BigData is needed because
much of the data at the meteorological station is organized in semi-format
format. Therefore, instead of using the BigData service already available
online, the company decided to create and use the environment personally.
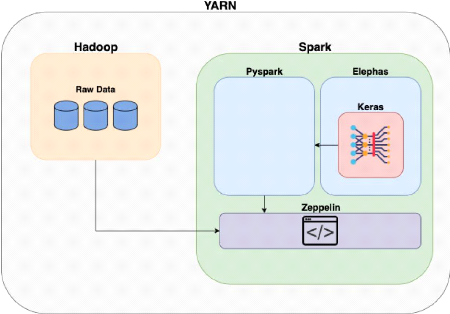
Hadoop connects several equipment in a parallel structure to create a single
clustering[Figure 2]. Spark is a framework that uses BigData data stored in
Hadoop Filesystem (hdfs) to help preprocess and deep learning analysis within
the cluster
- 14 -
environment. The clustering are all managed by a node manager
named YARN. Docker was used to easily install and deploy Hadoop and Spark on
several physical machines. Zeppelin is an Integrated Development Environment
that can be used in Spark, which helps you conduct analysis in the Web
interface [Figure 1]. Finally, Elephas, the external package of Spark
Deep-Learning, was installed in the cluster and weather prediction modeling was
conducted
through deep learning.
|
Raspberry Pi 4
|
Arm 64 bits
|
|
Ubuntu
|
18.04 LTS
|
|
Hadoop
|
2.7.7.
|
|
Spark
|
2.4.0
|
|
Zeppelin
|
0.8.2
|
|
Python
|
3.6.9
|
[Table 2] Development Environment Version

[Figure 1] Logical Architecture

- 15 -
[Figure 2] Physical Architecture
2. DATA
2.1. Daily COVID-19 confirmed cases
Prior to the weather forecasting model, we identified the
frequency distribution of the number of confirmed cases by date in the ongoing
COVID-19. First, we collected COVID19 datasets from Wikipedia[17] and the Johns
Hopkins Coronavirus Resource Center[16]. Afterwards, visualizations were
carried out by organizing the dataset by date. In Iran, subsequent data were
not available because the number of confirmed cases was not counted by cities
since March 26, but only the total number of confirmed cases was announced. The
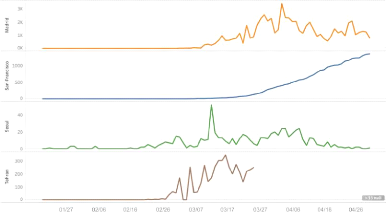
graph below is a graph of new confirmed numbers that occurred every day, and
the graph shows the change in the number of confirmed cases in four cities. It
was also possible to specify the day at which the number of confirmed cases was
increased.

- 16 -
[Figure 3] Confirmed case Trend at each date
In Seoul, the number of confirmed cases has been on the decline
since March 10, when the number of confirmed cases reached 52. Madrid has seen
a decline since 3,419 confirmed cases on March 30. Tehran has seen a downward
trend since peaking 347 confirmed cases on March 14. San-Francisco, a steady
increase in the number of confirmed cases has been seen since early March
[Figure 3].
2.2. Max Temperature Data
I wanted to use average temperature data and average humidity
data per day, but there were not many weather stations since 1950 and the
amount of data was limited. It was also assumed that human-to-human infection
of the COVID-19 virus is unlikely to occur because the minimum temperature is
generally recorded at night and there is a small floating population at dawn,
although daily minimum temperature data were available. For this reason, the
study was conducted using daytime maximum temperature data with a large
floating population instead of average temperature data and humidity data
[18].
| 
