Source: primary data
Figure 8 shows that for all respondents categorized by level of
dropout, increase in illiteracy level was confirmed by 21.67 percent from high
level of dropout schools against 10 percent from middle level representing the
lowest percentage who considered it to be among major consequences of dropout
at the national level. Secondary, fail to achieve the expected level of
education for all was claimed by 15 percent from low level of dropout schools
against 6.67 percent representing the lowest percentage from middle level of
dropout schools. Increased future cost due to illiteracy was mentioned by 6.67
percent from high level of dropout schools whereas other levels have an equal 5
percent. Finally 1.67 percent for both middle and low level of mentioned other
consequences to the country due to dropout.
4.4 Results from bivariate
analysis using chi-square test
The relationship between independent variables, namely
distance from school, child's failure or repetition, child's family poverty,
parents' illiteracy of children, child employment, the place of residence, as
well as the one cup of milk per child program to the level of dropout within
schools is presented in table 4.4. A chi-square test at 0.05 significant level
was used to examine the association between all the above mentioned factors to
the dropout level.
Table 7 Chi- square test
table illustrating association between level of dropout and its
factors
|
Variables
|
Values ( ) )
|
Degree of freedom
|
P-values
|
Test of association
|
|
Distance from school
|
3.928
|
2
|
0.14
|
No association
|
|
Parents' illiteracy
|
6.142
|
2
|
0.046
|
Weak association
|
|
Child's Family poverty
|
1.922
|
2
|
0.383
|
No association
|
|
One cup of milk per child
|
22.495
|
2
|
0.000
|
Strong association
|
|
Failure or repetition
|
0.064
|
2
|
0.969
|
No association
|
|
Child employment
|
2.047
|
2
|
0.359
|
No association
|
|
Place of residence
|
1.636
|
2
|
0.441
|
No association
|
Source: primary data
Many studies reviewed in chapter two have illustrated various
types of factors affecting the primary school dropout. This study illustrates
that the link between the distance from school and the level of dropout;
Chi-square test shows that the distance from school is not statistically
associated with the level of dropout because it p-value is greater than the
level of significance (p> ; 0.14>0.05). Looking to the one cup of milk per child program has a
strong relationship with the dropout level within schools as its p-value is
less than the level of significance (p< ; 0.14>0.05). Looking to the one cup of milk per child program has a
strong relationship with the dropout level within schools as its p-value is
less than the level of significance (p< ; 0.000<0.05) and again parents' illiteracy was proved to have a weak
relationship the level of dropout within schools as long as its p-value found
is less than the level of significance (p< ; 0.000<0.05) and again parents' illiteracy was proved to have a weak
relationship the level of dropout within schools as long as its p-value found
is less than the level of significance (p< ; 0.046<0.05) while the factors family poverty, failure or repetition
of children, children employment, and place of residence of schools were all
demonstrated to have no significant relationship with the level of dropout as
their respective p-values were greater than the level of significance (0.383,
0.969, 0.359, 0.441>0.05). ; 0.046<0.05) while the factors family poverty, failure or repetition
of children, children employment, and place of residence of schools were all
demonstrated to have no significant relationship with the level of dropout as
their respective p-values were greater than the level of significance (0.383,
0.969, 0.359, 0.441>0.05).
4.5. Conclusion
The chi-square analysis shows the relationship between the
level of dropout and the factors affecting the dropout of children at primary
level. Only one cup of milk per child program was proved to have a strong
relationship with the dropout level. In addition to the one cup of milk per
child program, parents' illiteracy was illustrated to have a weak relationship
with the level of dropout against other factors family poverty, distance from
school, place of residence of schools, failure or repetition child employment
who had no significant relationship with the level of dropout.
4.6 Results from multivariable analysis
A bivariate analysis was used to examine the relationship
between each independent variable and dropout within primary schools,
especially for the level of dropout. The findings from bivariate analysis
illustrate whether there is an association among independent variables and the
level of dropout. A bivariate analysis among two variables does not necessarily
imply a significant causal relationship between them. The multinomial logistic
regression analysis method was preferred in this study, which allowed the
identification of the effect of each independent variable on the level of
dropout. Only one cup of milk per child program and parents' illiteracy were
considered up to this step as long as they are the only variables with
significant relationship with the level of dropout.
During this analysis, two models were displayed, the first
model was high level of dropout to low level of dropout and the second was
middle level of dropout against the low level of dropout. The table 4.5
illustrates the coefficients that were used to build those models.
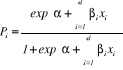
The logistic regression model estimates a model of the
form:
 = =
 : One cup of milk per child program : One cup of milk per child program  : Parents' illiteracy : Parents' illiteracy
Table 8 Parameter estimates
for multinomial logistic model
|
At which level is the dropout within your school
?a
|
B
|
Std. Error
|
df
|
Sig.
|
|
High
|
Intercept
|
1.362
|
.881
|
1
|
.122
|
|
[one_cup_milk=1]
|
-3.420
|
.834
|
1
|
.000
|
|
[one_cup_milk=2]
|
0b
|
.
|
0
|
.
|
|
[illiteracy=1]
|
.441
|
.908
|
1
|
.627
|
|
[illiteracy=2]
|
0b
|
.
|
0
|
.
|
|
Middle
|
Intercept
|
-17.740
|
.744
|
1
|
.000
|
|
[one_cup_milk=1]
|
-2.314
|
.875
|
1
|
.008
|
|
[one_cup_milk=2]
|
0b
|
.
|
0
|
.
|
|
[illiteracy=1]
|
19.136
|
.000
|
1
|
.
|
|
[illiteracy=2]
|
0b
|
.
|
0
|
.
|
a. The reference category is: low.
b. This parameter is set to zero because it is redundant.
Source: primary data
The logistic regression model for the high level of dropout is
displayed here below:

The logistic regression model for middle level of dropout is
displayed as follows:
 
The logistic regression coefficients indicate the direction of
the relationship by showing which factors increase or decline the likelihood of
high level of dropout within schools. The odds ratios represent the change in
odds of being in one of the categories of outcome when the value of a predictor
increases by one unit. For categorical independent variables, the test provides
a separate coefficient for each category of the variable. In addition, a
positive logistic regression coefficient for any category of an independent
variable is associated with an odds ratio greater than one, which indicates
that this category has a greater likelihood of experiencing the event relative
to the reference category.
The one cup of milk per child program is associated with the
level of dropout within schools with a negative direction for both yes and no
coded values. The one cup of milk per child is 3.42 times likely to decrease
the high level of dropout, 2.314 times likely to decrease the middle level of
dropout within primary schools.
The parents' illiteracy of children has a positive influence
on the level of dropout within primary schools, the Yes coded value is 0.441
times likely to increase the high level of dropout within primary schools, and
is 19.136 times likely to increase the middle level of dropout within
schools.
The multinomial logistic regression was used for groups of
variables to predict the change of probabilities for the level of dropout based
on the combination of independent variables included in the model. The
probabilities that a school will have the dropout (high and middle level) are
presented below:
The probability for a school to have a high level of dropout
with the one cup of milk per child program and experiencing parents' illiteracy
of children is calculated as the following:


The probability for a school to have a middle level of dropout
having the program of one cup of milk per child and experiencing the illiteracy
of child's parents is forth below demonstrated:


The probability for a school having both one cup of milk per
child and experiencing the illiteracy of child's parents to be at a middle
level of dropout is higher, with about 29 percent, than the probability of
being at a high level of dropout, with almost 17 percent.
CHAPTER FIVE: CONCLUSION AND
RECOMMENDATIONS
5.1 INTRODUCTION
This chapter presents the summary of research work, the major
findings concerned the Impact of one cup of milk per child on dropout reduction
are also given, furthermore the chapter presents down conclusions and
recommendations concerning policies, measures and strategies that can be
undertaken for dropout eradication among primary schools of Rwanda. The study
was conducted in 4 selected Huye primary schools, two having one cup of milk
per child program and other two without the program.
5.2 Discussion concerning the findings
The main objective of the study was to analyze the impact of one
cup of milk per child program on school dropout. The study further had the
specific objectives which were:
To identify the causes influencing primary school dropout in
Huye district; To examine the relationship between one cup of milk per child
and school dropout level in primary schools of Huye district; To find out the
consequences associated with school dropout in Huye district.
Basing on the objectives of the study primary data was
collected with the use of questionnaire distributed among respondents; other
data collection methods that were used by researcher to obtain data were
documentation, interview, as well as observation.
The findings revealed that majority of selected respondents
accordingly their gender female occupied a higher percentage of respondents
with 67.7 percent. Accordingly their educational level, those with secondary
and technical education level occupied 85 percent this means that female in
education industry are abundant that is to say that empowering girl's education
is at the same time providing a sustainable education system.
For all respondents on whom the study was conducted, the
greater percentage was that of the low level of dropout schools reaching 43.3
percent, though a lot has been made towards the growth of education system in
Rwanda but there is still a need to keep on track improving the system for
other levels such as high and middle, counting 56.7 percent, to be totally
eradicated from primary schools within Rwanda.
| 

