DECLARATION A
I,
Damien Nzabihimana, declare that this thesis is my original work and has never
been presented for any award in any university or any institution of higher
learning. In any instances where the work of others has been used, due
acknowledgement has been given.
______________________________
Damien Nzabihimana
______________________________
Date
DECLARATION B
«I confirm that the work reported in this dissertation
was carried out by the candidate under my supervision».
______________________
Names: Mr. Ochan Joseph
______________________
Date
APPROVAL SHEET
«This dissertation entitled the nature of schools and
academic performance of pupils in primary schools in Gasabo District Kigali
city presented by Damien Nzabihimana in partial fulfillment of the requirement
for the degree of Master in Education management has been examined and approved
by the panel on oral examination with the grade of PASSED.
____________________________
Name and Sig. of Chairman
________________________ ________________________
Name and Sig. of Supervisor Name and signature of panelist
________________________
_________________________
Name and Sig. of panelist Name and
signature of panelist
Date of Comprehensive Examination:
____________________________
Grade: ____________________________
___________________________
Name and Sig. of director, SPGSR
____________________________
Name and Sig. of DVC, SPGSR
DEDICATION
This work is dedicated to Miss
Virginia Nyirantibizerwa who does not cease to fully support me all the
time.
ACKNOWLEDGEMENT
This
research has been a result of the contribution and effort of several
individuals. Indeed, I wish to express my sincere thanks and gratitude to my
supervisor Mr. Ochan Joseph for his tireless effort he put in guiding me on how
to go about it.
In the
same way, I thank all my lecturers in the School of Postgraduate Studies for
their great contribution towards my training at Kampala International
University.
I owe
my appreciation to teachers and head teachers of the schools where all the
primary data for this study were obtained. I also thank the staff of the Rwanda National
Examinations Council (RNEC) who accepted to provide me with the secondary data
used in this research.
My
appreciation also goes to my classmates for the encouragement and moral support
rendered to me during the time of undertaking this study. Through sharing, we
encouraged and built esprit de corps in one another to achieve the
common goal, despite all difficulties encountered individually or
collectively.
To you
all, may the Almighty God grant peace all the time!
ABSTRACT
The purpose of this study was to establish the relationship
between the nature of schools and the academic performance of pupils in primary
schools in Gasabo district Rwanda. Specifically the study wanted to (i) compare
the academic performance of pupils in public and private primary schools in
Gasabo district Rwanda; (ii) to establish the effect of availability of school
facilities on pupils' academic performance and (iii) to establish the effect of
teacher Quality on pupils' academic performance in Gasabo district Rwanda. The
study was done by developing a conceptual framework relating the nature of
schools to pupils' academic performance. Using a descriptive cross-sectional
survey design, data were collected from 40 teacher and 10 head teacher using
questionnaires and interview guide as the main data collection instruments.
Also data on PLE results for 300 pupils in the selected primary schools was
obtained which was used in comparing pupils' performance in the two categories
of schools. Data were analyzed using frequency tables and summary statistics
and lastly using t-test in comparing pupils' performance in private and public
primary schools in Gasabo.
The study revealed that there is a difference in the academic
performance of pupils in public and private primary pupils in Gasabo district
with pupils in private primary schools performing batter than their
counterparts. School facilities and teacher quality were also found to be
affecting academic performance in Gasabo district. The recommendations of the
study were (i) Government providing public and private subsidized primary
schools with required facilities so as to create in them a welcoming
environment for teaching/learning process, (ii) the Ministry of education
should reduce the bureaucracy in the school administration, allowing public
schools to diversify their sources of funding (iii) Politicians and other
officials of Rwanda should also keep monitoring and evaluating the quality of
public education in primary schools and take general decision in favor of all
citizens of Rwanda as far as education is concerned and (iv) the value of a
teacher's quality in terms of experience, qualification, ability to prepare for
lessons should be honored and compensated in order to give teachers the
motivation to adequately do their jobs and support pupils learning to improve
on their performance.
TABLE OF CONTENT
DECLARATION A
i
DECLARATION B
ii
APPROVAL SHEET
iii
DEDICATION
iv
ACKNOWLEDGEMENT
v
ABSTRACT
vi
TABLE OF CONTENT
vii
LIST OF TABLES
xi
LIST OF FIGURES
xii
LIST OF ACCRONYMS AND ABBREVIATIONS
xiii
CHAPTER ONE
PROBLEM AND ITS SCOPE
1
1.1. Background to the Study
1
1.2 Statement of the Problem.
4
1.3. Purpose of the Study
6
1.4. Objectives of the Study
6
1.5 Research
Questions
6
1.6 Research
Hypotheses
6
1.7. Scope of the Study
7
1.8. Significance of the Study
7
1.9. Operational Definition of terms
8
CHAPTER TWO
LITERATURE REVIEW
9
2.1. Conceptual Framework
9
2.2 Theoretical perspective
10
11
2.3 Related Literature
11
The Determinants of Student Performance
11
Teachers' Degree Levels
13
Teachers' Years of Experience
13
Factors Affecting Private versus Public
School Decisions
17
CHAPTER THREE
METHODOLOGY
21
3.1. Research Design
21
3.2. Research Population
21
3.3. Sample and Sampling Procedures
21
Table3. 1: List of 10 Schools Selected and
Number of People Taken in Sample
22
3.4. Instruments
22
3.4.1. Interview Guide
23
3.4.2. Questionnaire
23
3.4.3. Inventory form
23
3.5. Validity and Reliability
23
3.6. Data Analysis
24
3.7. Ethical Consideration
24
3.8. Limitations of Study
24
CHAPTER FOUR
DATA PRESENTATION, ANALYSIS AND
INTERPRETATION OF DATA
26
4.1. Overview
26
4.2 Background of the Respondents
26
Qualification of respondents
27
Working experience of respondents
28
4.2 Comparison of
pupils' academic performance in public and private and private primary schools
in Gasabo District.
28
4.3 School Facility
Availability and Pupils Academic Performance
29
Table 4.6 Resource Demand and Supply in 5
Selected Private Primary Schools of Gasabo District
30
Table 4.7 Resource Demand and Supply in 5
Selected Public Primary Schools of Gasabo District
34
CHAPTER FIVE
FINDINGS, CONCLUSIONS, RECOMMENDATIONS
39
5.1. Introduction
39
5.2. Findings
39
5.3. Conclusion
42
5.3. Recommendations
44
5.4. Suggestions for Further Research
45
REFERENCES
46
APPENDICES
51
APPENDIX A: TRANSMITTAL LETTER
51
APPENDIX C: TIME FRAME
52
APPENDIX D: INTERVIEW GUIDE FOR HEAD
TEACHERS
53
APPENDIX E: QUESTIONNAIRE TO TEACHERS
54
APPENDIX F: OBSERVATION GUIDE/INVENTORY FOR
EDUCATIONAL RESOURCES
56
APPENDIX G: MAP OF KIGALI PROVINCE SHOWING
LOCATION OF GASABO DISTRICT
58
APPENDIX H: TOP 10 PERFORMERS - P6 Acad.
Year 2008
59
APPENDIX I: TOP 10 PERFORMERS - P6 Acad.
Year 2009
60
APPENDIX J Marks for the 300 pupils from
the 10 sampled schools (2005 -2007)
61
LIST OF TABLES
Table 3.1: Sample categories of respondents
..................................................................28
Table 4.1: Respondents by category
...............................................................................32
Table 4.2: Sex category of respondents
.........................................................................33
Table 4.3: Respondents by qualification
.........................................................................33
Table 4.4: Respondents by working experience
.............................................................34
Table 4.5: Two tailed test for difference in pupils
performance ....................................35
Table 4.6: Respondents resource demand and supply in private
schools.......................36
Table 4.7: Respondents resource demand and supply in public
schools........................42
LIST OF
FIGURES
Figure 1: Conceptual Framework:
.......................................................................................9
LIST OF
ACCRONYMS AND ABBREVIATIONS
ACE: Australian College of Educators
CRESST: Centre for Research on Evaluation, Standards &
Student Testing (USA)
EFA: Education for All
MINECOFIN: Ministère des
Finances et de la Plannification Economique [it was formerly called
« Ministère de l'Economie et des Finances i.e. Ministry
of Economy and Finance» (today's «Ministry of Finance and
Economic Planning»)
MOE: Ministry of Education
NCES: National Center for Education Statistics (Australia)
RNEC: Rwanda National Examinations
Council
PRSP: Poverty Reduction Strategy Papers
TV: Television
UPE: Universal Primary Education
WASC: West African School Certificate
CHAPTER
ONE
PROBLEM AND ITS SCOPE
1.1. Background to the Study
Education is the primary agent of transformation towards
sustainable development. It increases people's capacities to transform their
visions for society into reality. All countries strive for quality education
for their sustainable development. The government of Rwanda, like any other
African country, considers education as a fundamental human right and an
essential means to ensure that all Rwandans realize their full potentials. It
places special emphasis on basic education as a priority area within the
Poverty Reduction Strategy Papers (PRSP) because of the strong correlation
between education and improved economic opportunities, better life and fewer
children (family planning), especially for girls. [Ministry of Finance and
Economic Planning (MINECOFIN), 2005:40].
The Government of Rwanda cannot satisfy educational needs of
its increasing population, so the private sector also plays a great role in
educational development by creating schools known as private schools which
operate at all levels of education from the nursery to the tertiary and enroll
a good number of people. In the past, the historical growth in enrolment was
largely a public sector phenomenon, involving schools financed almost entirely
by the government and managed either by the government itself or, in the case
of private subsidized schools, by churches and other organizations. (World
Bank, 2004: 32).
At any education level, the quality of education depends upon
several factors such as: school facilities, teachers' qualifications, teachers'
motivation, management and administration, etc. In other words, a quality
school is a school where: pupils respect their peers, their teachers and their
school management; have a voice in decision-making, are interested and engaged
in their learning; accept responsibility; receive feedback and encouragement
from their teachers and feel valued. In addition, teachers work together and
share ideas, feel valued and are given support to be innovative, employ
teaching strategies that are varied and personalized to meet the needs of all
learners. Others are that administrative and support staff work as valued
partners with principals and teachers to ensure that students are supported in
their learning and that school systems work effectively to support teaching and
learning.
The school as a whole is committed to continuous improvement
and forms learning partnerships within and beyond the school. It develops plans
and targets that address its goals, seeks feedback on its performance, uses
data to reflect on its outcomes, reports openly and honestly and celebrates its
achievements. It is known that an individual's quality of life and the well
being of the society depend on the quality of education. Pupils' performance in
primary leaving examinations will greatly depend on the quality of education
that pupils have gained in school.
The key concepts in this study are that nature of schools
(independent variable) which is conceptualized in terms of two categories;
public and private schools and performance of pupils (dependent variable)
conceptualized in terms of score in assessment test given to pupils' national
examinations.
Parents or guardians are always trying to make the best
decisions for their children and their future. They often have to choose
whether to send their children to private school or keep them in public
schools. Parents will have one or more factors that concern them. According to
the National Center for Education Statistics [NCES] (2002), when looking at
public or private schools, number of factors comes into play which include;
Academic reputation and college preparation; School size and Class size; Safety
reputation; Special programs; Costs; Religious and Moral instruction; Location
and Ideology.
Public schools offer a general program, designed for all while
private schools have the flexibility to create specialized programs for
learners. For example, private schools may use art or science in all classes,
or take children on outdoor trips. They can create their own curriculum and
assessment systems, although they also respect the general program of the
Ministry of Education.
In Rwanda, at many aspects private subsidized schools do not
differ significantly from public schools in that, public education is education
given to the children of the general public by the government, at national,
regional, or local, and from the kindergarten through to the university levels.
Public education is inclusive, both in its treatment and admission of students.
Public education is often organized and operated to be a deliberate model of
the civil community in which it functions. It is not a mistake to say that
private subsidized schools respond to public education. The differences found
there do not have significant impact on pupils' academic performance. They are
about the recruitment of management staff, the type of religion to study, some
additional funding from the religious congregation that founded the school.
While they share many characteristics in common: public and private subsidized
schools get the same funding from the government in accordance with their
respective enrolment, their teachers are paid by the government, they have the
same obligations to enroll all children without any discrimination etc. In this
study, these two types of schools will be considered alike under the same term
«public education» and «public school».
Admissions into public and private subsidized schools are by
social demand. So to enroll in a public school or private subsidized school
parents simply register children by filling out the necessary forms. Public
schools and private subsidized schools must accept any resident pupils who
apply for admission, regardless of sex, race, religious affiliation, economic
status or physical or mental handicap; while private schools are not obligated
by any laws regarding admission. Therefore, private school admission is
competitive. Also, private schools are not required to provide educational
programs for children with special needs. Private schools are also under no
obligation to keep a student enrolled. If a child's behavior disrupts the
school's milieu, they can be discontinued. Another scenario to keep in mind is
that if a child's academic progress is not acceptable, they may be discontinued
as well.
According to Rwanda National Examinations Council, (RNEC)
2009, prior to the period 1994, certification and selection to high levels of
learning were based mainly on schools' internal assessments which were
characterized by subjectivity towards ethnicity, regionalism, nepotism,
favoritism and total corruption. This was followed with a law no. 14/1985 of
29th June 1985 concerning primary integrated rural trade and secondary
education which was: Emphasizing exclusivity and not competence based on
individual performance.
One of the challenges of the Government of national unity
(Government set after 1994 genocide) was to establish a body that would
eradicate at all costs all forms of discrimination in education system and
establish on objective, fair, and transparent system in which the main
indicator for equity in education system is the individual performance level
and the right of choice to any school or institution in Rwanda. It is for this
reason that the Rwanda National Examinations Council was created by the
Presidential Decree of 01/05/2003.
Since the RNEC was created, the comparison between public and
private primary schools shows that pupils of private primary schools tend to
perform better than their counterparts of public and/or private subsidized
schools. The RNEC has a culture of celebrating excellent performance of pupils
in the top ten positions in final examinations and for the case of PLE, almost
all the top ten come from private primary schools. This became an issue concern
to the researcher and it prompted a research on the effect of the nature of
primary school on pupils' academic performance in Gasabo District.
1.2 Statement of the Problem.
Since the creation of the RNEC, the difference in performance
between private and public primary schools of Rwanda has been a reason for
privileged parents to opt to enroll their children into private primary
schools. As asserted by The Centre for Research on Evaluation, Standards &
Student Testing (2009), the Right School is Only the Beginning of a Lifetime of
Educational Enjoyment. Finding a good school for one's child is only the
initial step. The education of the child is above all a cooperative effort that
involves the school, teachers, parents and the community. Since almost all
primary schools of Rwanda follow the same curriculum set by the MOE, then could
the reason why people think the private schools are better be because the
teachers and/or the quality of teaching are better than those in the public
schools (who, it is believed, are more well paid and more qualified with
schools which have better facilities)? If this is true, then it would be
necessary to know why then public teachers are not doing well. If this is not
true then why public teachers and the MOE's officers and staffs (who are
looking after the quality of public schools) send their own children to private
schools (which just show their own lack of faith in the quality of their own
teachings/system)? Afolabi A.O. (2005) examined the influence of a specified
primary school education experience on the academic performance of junior
secondary students and found that students with private school background
performed better than their counterparts with public school background in
English and Mathematics. While this study was comparing performance in private
and public schools it was not in Rwanda's context a gap this study thought to
bridge.
In addition, in Rwanda, as in any third world county, private
primary schools are attended by privileged children from rich or privileged
homes. For example, in Rwanda, by simple observation it is true that there is
almost no private primary school in rural districts while in Kigali city
districts, the number of private primary schools tend to surpass the number of
public and private subsidized ones. In rural areas those schools cannot find
customers simply because rural families are generally poor. According to
Winkler and Vander G. (1996), pupils from poor families are also condemned to
attend poor schools where modern infrastructures such as electricity and other
related development indicators are still inexistent, pupils will have many
occasions to be absent from school looking for subsistence means, and there may
be so many problems relating to health and malnutrition, problems that tend to
dramatically limit educational opportunities by lowering and impeding
concentration and cognitive development. While a number of factors account for
the varied academic performance of pupils in primary schools, the nature of the
schools seem to play a key role, hence the need for this study to determine the
effect of the nature of the school on the academic performance of pupils using
the case of Gasabo district in Kigali city Rwanda.
1.3. Purpose of the Study
This study aims at
comparing pupils' performance in public and private primary schools of Gasabo
District. It also establishes the relationship between availability and
adequacy of school resources and pupils' academic performance.
1.4. Objectives of the Study
The study was guided by the following objectives
1. To compare pupils' performance in public and private
primary schools in Gasabo district Rwanda.
2. To establish the relationship between school facilities and
pupils performance in Gasabo districts in Rwanda.
3. To establish the relationship between teacher quality and
pupils academic achievement in Gasabo district Rwanda
1.5 Research Questions
The study provided answers to the following Questions
1. What is the difference in performance between public and
private primary schools in Gasabo district Rwanda?
1 What is the relationship school facilities and pupils
performance in Gasabo districts in Rwanda?
2 What is the relationship between teacher quality and pupils
academic achievement in Gasabo district Rwanda
1.6 Research Hypotheses
1. There is a significant difference in performance between
public and private primary schools in Gasabo district Rwanda
2. There is a significant relationship school facilities and
pupils performance in Gasabo districts in Rwanda?
3. There is a significant relationship between teacher quality
and pupils academic achievement in Gasabo district Rwanda
1.7. Scope of the Study
Geographically, the study
was carried out in Gasabo District, one of the three districts (GASABO,
KICUKIRO, NYARUGENGE) making up Kigali City, the capital city of RWANDA. In
content terms the study compared the performance in PLE of pupils in private
and public primary schools for a period of three
years (2005 - 2007). It established the relationship between school facilities,
teacher quality and pupils academic performance.
1.8. Significance of the Study
The findings from this study will be useful:
To Rwanda primary school managers, the findings of the study
will help them establish how to enhance quality in their education;
To education planners, the study findings will help them find
out how school resources play an important role in the teaching/learning
process and hence to pupils' performance;
To parents and/or guardians, the study findings will guide
them in identifying reason why they should seek quality education instead of
any other motive to enroll their children in such and such primary schools;
To the government of Rwanda and other policy makers the study
findings will provide information the inequality in education and they will
also reveal to them that this inequality is not only closed by setting central
exams but also by considering other factors.
1.9. Operational Definition of
terms
Public schools : Schools which are funded
by the government
and administered by government appointees whose
Teachers and other staff are paid by the government
Private schools : Schools which are
established, funded and
managed by the private sectors
Schools Facilities : school equipment and
materials used to
facilitate the teaching learning process
Teacher Quality : Abilities and
competencies of a teacher
determined by their qualifications, experience
and mode of
delivery during the
teaching/learning process.
Academic performance : Measurement of academic performance
and
progress of individual pupils
CHAPTER TWO
LITERATURE REVIEW
2.1. Conceptual Framework
Figure 1: Conceptual Framework of Pupils' Performance
in Private and Public Primary Schools
Intervening Variables
Dependent Variable
|
Public primary schools
Private primary schools
Teacher Quality
School facilities
|
Independent Variable
Academic reputation
Religious & moral instruction
Ideology
School size and class size
Safety reputation
Special programs
Location
Hard work of pupils & teachers
|
Academic performance
Average scores in national examinations
|
Source: Researcher's design
The
conceptual framework in Fig. 2.1 is a schemer or model that reflects the
interrelationship between the two variables in the study. According to the
model (Fig. 2.1) the independent variable (i.e. nature of schools) is
conceptualized in terms of public and private primary schools which are assumed
to affect pupils' academic performance (dependent variable). The framework
further reflect that there are other factors referred to as intervening
variables which are assumed the moderate the relationship between the
independent and the dependent variable.
2.2 Theoretical perspective
Attribution theory (Weiner, 1980, 1992) cited in Weiner, B.
(2000) is probably the most influential contemporary theory with implications
for academic motivation. It incorporates behavior modification in the sense
that it emphasizes the idea that learners are strongly motivated by the
pleasant outcome of being able to feel good about themselves. It incorporates
cognitive theory and self-efficacy theory in the sense that it emphasizes that
learners' current self-perceptions will strongly influence the ways in which
they will interpret the success or failure of their current efforts and hence
their future tendency to perform these same behaviors.
According to attribution theory, the explanations that people
tend to make to explain success or failure can be analyzed in terms of three
sets of characteristics:
First, the cause of the success or failure may be internal or
external. That is, we may succeed or fail because of factors that we believe
have their origin within us or because of factors that originate in our
environment.
Second, the cause of the success or failure may be either
stable or unstable. If the we believe cause is stable, then the outcome is
likely to be the same if we perform the same behavior on another occasion. If
it is unstable, the outcome is likely to be different on another occasion.
Third, the cause of the success or failure may be either
controllable or uncontrollable. A controllable factor is one which we believe
we ourselves can alter if we wish to do so. An uncontrollable factor is one
that we do not believe we can easily alter.
An important assumption of attribution theory is that people
will interpret their environment in such a way as to maintain a positive
self-image. That is, they will attribute their successes or failures to factors
that will enable them to feel as good as possible about themselves. In general,
this means that when learners succeed at an academic task, they are likely to
want to attribute this success to their own efforts or abilities; but when they
fail, they will want to attribute their failure to factors over which they have
no control, such as bad teaching or bad luck.
The basic principle of
attribution theory as it applies to motivation is that a person's own
perceptions or attributions for success or failure determine the amount of
effort the person will expend on that activity in the future. There are four
factors related to attribution theory that influence motivation in education:
ability, task difficulty, effort, and luck. On the basis of this theory
the study suggest that pupils' academic performance is determined by the nature
of schools.
2.3 Related Literature
The
Determinants of Student Performance
Education is a very costly project for nations and individual
families. Therefore, it is very crucial to understand the factors affecting its
provisions and the performance of learners. The majority of studies on student
performance have related student performance to various aspects of education,
such as school quality, teaching quality, teacher remuneration, class size, and
Learners' characteristics.
Teacher Remuneration
Remuneration refers to payment or compensation
received for services or employment. This includes the base salary and any
bonuses or other economic benefits that an employee or executive receives
during employment, (Investopedia, 2010). Thus teacher remuneration
refers to the total compensation received by a teacher, which includes
not only the base salary but options, bonuses, expense accounts and other forms
of compensation. A study on schools in India investigated the relationship
between performance-related pay and student achievement (Kingdon & Teal,
2002), addressing the important issue of endogeneity in the relationship
between pay and achievement. They found strong evidence that
performance-related pay in the private sector affects student achievement, but
no evidence of a similar cause-effect relationship in public schools. In
Rwandan education system, private schools teachers are better paid than in
public schools. This difference in payment is very important at primary school
level where a private primary school teacher earns up to three times the salary
of a public primary school teacher. The fact that a teacher is well paid plays
an important role on his /her work performance and on his/her pupils'
performance as well. Even though the salary may not be the main motivator of
teachers, it plays a very important role in this issue.
Regarding the importance of teachers in general, Archer (1999)
and Armentano (2003) argue that teachers are the most important influence on
student progress, even more important than socioeconomic status and school
location. Furthermore, Darling-Hammond (2000) concludes that measures of
teacher preparation and certification are by far the strongest correlates of
student achievement in reading and mathematics.
Teacher Quality
Teachers are central to any consideration of schools, and a
majority of education policy discussions focus directly or indirectly on the
role of teachers. There is a prima facie case for the concentration on
teachers, because they are the largest single budgetary element in schools.
Moreover, parents, teachers, and administrators emphasize repeatedly the
fundamental role that teachers play in the determination of school quality. Yet
there remains little consensus among researchers on the characteristics of a
good teacher, let alone on the importance of teachers in comparison to other
determinants of academic performance. Teacher quality is the concept that
embodies what the teacher does and they can do in terms of their assigned roles
in the school. Related to the concept of teacher quality is teaching quality
and it has been observed that one way of determining the quality of teaching in
schools is by looking at the intermediate outcome of student performance
(Sanders, 1999). There are several ways to evaluate a student's
«quality» attributable to formal education, but the most tractable
indicator is how he or she performs in tests (World Bank, 2003).
Teachers' Degree Levels
Teacher quality involves the level of qualification and
research on the value of a teacher's advanced degree is mixed: some studies
show that while additional teacher education has a positive correlation with
student achievement in some cases, others find that it negatively affects
achievement (Greenwald, Hedges, & Laine, 1996; Hanushek, 1986). Goldhaber
and Brewer (1997) found that a teacher's advanced degree is not generally
associated with increased student learning from the eighth to the tenth grade,
but having an advanced degree in math and science for math and science teachers
appears to influence students' achievement. The same results were not found to
be true for teachers of English or history. In the same way Goldhaber and
Brewer (1997) suggest that the findings of other studies about the impact on
student achievement of teachers' advanced degrees are inconclusive because they
considered only the level of the degree and not the subject of the degree,
which may affect student achievement in different ways than the degree level.
Nevertheless, results from all the studies seem to imply that there is not a
positive correlation between teachers having advanced degrees in subjects other
than those they teach and student achievement.
Teachers' Years of Experience
There is a wide range of findings on the relationship between
years of teaching experience and student outcomes. Hanushek (1986) found that
fewer than half of the 109 previous studies on the estimated effects of teacher
experience showed that experience had any statistically significant effect on
student achievement; of those, 33 studies found that additional years of
experience had a significant positive effect, but seven found that more
experience actually had a negative impact on student achievement. Other studies
show a stronger positive relationship between teacher experience and student
outcomes in some, but not all, cases they reviewed (e.g., Greenwald et al.,
1996). Murnane (1995) suggests that the typical teaching learning curve peaks
in a teacher's first few years (estimated at year two for reading and year
three for math).
It is also plausible that a positive finding on experience
actually results from the tendency of more senior teachers to select
higher-level classes with higher achieving students (Hanushek, 1986). Thus we
might reasonably infer that the magnitude of the experience effect, should it
exist, is not terribly large.
Teacher absenteeism, an observable indicator of teacher effort
and performance, has been the focus of several recent studies. Chaudhury et al.
(2000) report on surveys in six developing countries that yield observational
data on absence of teachers and health workers: India, Uganda, Peru, Ecuador,
Bangladesh and Indonesia; averaging across the six countries, they found an
absence rate of 19 percent among primary school teachers. Teacher absence
predicts lower scores of pupils in tests in general.
Being still on human resources concern, various educators for
example, Ukeje (1970) and Fafunwa (1969) have written extensively on the prime
importance of teachers to the educational development of any nation albeit
simple, complex, developed or developing. From the writings of these
educators, one can infer that whatever facilities are available, whatever
content is taught, whichever environment the school is situated and whatever
kind of pupils are given to teach, the important and vital role of the teacher
cannot be over-emphasized. Assuming that necessary facilities are
adequately provided for, the environment is conducive to learning, the
curriculum satisfies the needs of the students and the students themselves have
interest in learning, learning cannot take place without the presence of the
teacher. Fagbamiye (1977b) noted that schools with stable, experienced and
qualified teachers usually have better school facilities in terms of school
buildings, books and equipments than those schools which have difficulty in
attracting experienced and qualified staff. Teachers' conditions in private
primary schools of Rwanda seem to be better than those of their counterparts of
public primary schools and thereby, their motivation differs accordingly;
therefore, this has an effect on pupils' academic performance.
School Size and Class Size
About class size, a comparative study of public schools among
US states found that in Tennessee, smaller class sizes contribute positively to
student learning, particularly in fields like elementary reading
(Darling-Hammond, 2000). In another assessment, Angrist & Lavy (1999) use
regression-discontinuity design and find that reducing class size increases
fourth- and fifth-grade test scores in Israeli public schools. For the case of
Rwandan schools, public primary schools are very crowded (especially because of
EFA principles) at an extent of 70 pupils and beyond per class while in private
primary schools, a big class doesn't hosts more than 35 pupils. This can be a
positive factor of good pupils' performance in private primary schools of
Rwanda in that teacher can individualize his/her teaching very easily if the
class is not too big. Similarly, Case & Deaton (1999) separate their sample
of South African data into races, notably Blacks and Whites, and look at the
impact of pupil-teacher ratio on education attainment, enrolment, and numerical
and literacy test scores. Especially for the test score results among Blacks,
they find that when school facilities and education attainment are included as
controls, a higher pupil-teacher ratio has a negative effect on mathematics
score but a positive and insignificant effect on literacy. If higher
pupil-teacher ratio has a negative effect on math score it is because math asks
a great concentration and, in most cases, an individualization of teaching.
Being so, all teaching subjects that need a great concentration like geography,
physics, chemistry etc. are likely to be negatively influenced by a high
pupil-teacher ratio.
School Quality and Socio-Economic and Cultural
Level of Parents/Guardians
In enumerating the factors that could be responsible for
varying intra-and inter-school/academic achievement, Coombs (1970), listed four
important factors including the acute scarcity of instructional resources which
he said constrained educational systems from responding more fully to new
demands'. He claimed that, in order to do their part in meeting the
crisis in education, educational systems will need real resources that money
can buy, they will need a fuller share of the nations' manpower, not merely to
carry on the present work of education, but to raise its quality, efficiency
and productivity. They will need buildings, equipments and more learning
materials.
Momoh (1980) carried out a research on the effects of
instructional resources on students' performances in WASC examination in Kwara
State. He correlated material resources with academic achievements of
students in ten subjects. Information was collected from the subject
teachers in relation to the resources employed in teaching in five
schools. The achievements of students in WASC examinations for the past
five years were related to the resources available for teaching each of the
subjects. He concluded that material resources have a significant effect
on students' achievement in each of the subjects. For the case of primary
schools of Rwanda in general, it is very clear that public primary schools do
not have enough means in terms of money to buy the required instructional
materials as they have almost only one funding source which is the government
and for private subsidized primary schools they can get another additional
funding source, the founder (e.g. religious congregation) of the school, but in
several cases this funding is not always operational. These schools are
restricted from making money by the law, local leaders at all levels and by the
parents' feeling that primary education is given freely in the light of UPE.
While private primary schools have varied ways of making money as they have no
restrictions, they can order the increase of the cost of education whenever
they want, they can do school businesses like opening a boutique, farming,
etc.; they can ask parents to buy any material needed at any cost and time if
it deems necessary.
The overall framework of schooling and schooling outcomes can
be posited as having supporting inputs which flow into schools where schooling
conditions are set to produce what we want to recognize as school outcomes
(Heneveld 1994; Heneveld &Craig 1995). Contextual factors in generating
school outcomes are the political will to embark on and support a schooling
system, the economic muscle to support and sustain the system, the cultural
milieu and how the school system aligns itself to the global trends in
education. All these help to shape the kind of outcomes we expect to see in
children who pass through the system. Directly linked to schooling itself are
moral, material and human resources made available to the school where a
conducive climate with the right mix of conditions are manipulated in a
classroom to produce desirable outcomes.
Learners' Characteristics
About the learners' characteristics as factor to academic
performance, very important are the children themselves with regard to how
ready they are to blend into the mix we call schooling. It is clear that the
factors are connected in an intricate way since we are dealing with social
issues where how one factor influences an outcome cannot be entirely
independent of the many other factors in the process.
However, when basic and fundamental elements of schooling are
considered it is possible to change the outcomes considerably because there is
little influence from external factors. When rudimentary schooling systems are
considered most external influences become minimized and changes in the basic
elements of schooling can lead to measurable changes in the outcomes.
Factors Affecting Private versus Public School Decisions
Public primary schools are schools that are provided by state
funding. More than ninety percent of the primary school children today in
Rwanda attend public primary schools. Private primary schools are primary
schools which are funded by private persons (parents) or private institution
(e.g. Churches). Clearly, there are many more public schools that provide
education to Rwandese pupils than their counterparts private.
Availability and Adequacy of Educational
Resources
On the availability and adequacy of school resources, it is
obvious that in Rwanda as in any other third world country, private schools are
more favored than public ones. Considering the relationship between educational
resources and students' academic performance, teacher's qualification and
adequate facilities may be determinants of assessing academic performance of
students. Hence the availability or non-availability of facilities and their
adequacy in schools have an effect on the academic performance of pupils in
primary schools of Rwanda. This is in agreement with some educationalists who
believe that teaching materials facilitate teaching and learning activities,
which result in effective teaching and improve academic performance. The
school is an essentially human organization; because it has human operatives,
clients and products, hence students' performance has positive relationship
with the quality of teachers. The importance of adequate staffing of a school
is clearing demonstrated by the way parents continue to drift from one school
to another in search of school with better -qualified teachers. For efficient
educational management, facilities help the school to determine the number of
pupils to be accommodated, number of teachers and non-teaching personnel to be
employed and the cost determination for the efficient management of the system.
The school climate is determined by the resources, especially class rooms
under which the teachers and pupils operate which influences attitude in
teaching and learning. Un-conducive classroom creates stress on teachers and
pupils resulting in negative attitude toward school and learning by pupils.
Facilities below approved standard could also lead to reduction in quality of
teaching and learning in schools causing poor pupils' academic performance.
The school environment affects academic achievement of pupils.
Facilities such as, desks, seats, chalkboard, teaching aids, and cupboard are
ingredients for effective teaching and learning. A good education policy or
programmed to guarantee quality outputs, it must be serviced
optimally with appropriate trained and motivated teaching staff, adequately
supplied with necessary facilities and equipment.
In other words, a good school must have adequate resources
which may be divided into three categories: Financial resources, human
resources and physical (material) resources.
The human resources are teachers and the non-teaching staff,
and physical resources mean facilities including classrooms, desks, toilets,
offices, books and teaching aids; all these resources cannot be acquired
without financial resources.
Because public schools are required to admit all students, the
students attending them paint a picture of the community they come from. As
such, there is often a diverse mixture of backgrounds present in public
schools. Private schools tend to be more homogenous due to the admission and
selection process and the type of student that will apply to take part in a
private school based on its reputation. One common reason for sending a child
to private school is the smaller class sizes. Private schools can afford to
keep class sizes small, thus providing more frequent interaction and attention
on the teacher-student level which is a desirable feature. When the law says
that all children have the right to be educated, this includes students with
special needs. Public schools offer education programs for those who are
physically or mentally handicapped in some fashion and provide teachers who are
qualified to work with these needs. As mentioned before, private schools can
admit or deny an applicant based on their own criteria, and this includes
special educational needs. Although there are some private schools intended
solely for those with these needs, many private schools do not accept special
education cases.
As stated above, when looking at public or private schools,
the following factors come into play: Academic reputation and college
preparation, school size and class size, safety reputation, special programs,
costs, religious and moral instruction, location, ideology.
Academic Reputation and College
Preparation
Academic reputation plays a big role when considering
private versus public schools. Unfortunately for most families, children must
go to the public school that their home is zoned in. Usually there is a
perceived or statistically supported issue with a public school's academic
record that flags a parent's concern and willingness to move their child into a
private school. Private schools usually have a more rigorous academic
reputation but this depends upon the country and the education level. For
example, in Rwanda, private primary schools have a more rigorous academic
reputation than public ones while there is an opposite phenomenon at secondary
school level. However, there is exception in lower catholic seminaries because
they have a more rigorous academic reputation as their students are the best
performers at O' and A-level leaving examinations. In fact, students who are
enrolled in private secondary schools are those who have failed the PLE as
those who succeed are immediately admitted into public secondary schools. For
the lower catholic seminaries, students are chosen among the best pupils before
the PLE are passed.
CHAPTER THREE
METHODOLOGY
3.1.
Research Design
This study employed a quantitative paradigm with a descriptive
correlational design to compare the academic performances of pupils in private
and public primary schools of Gasabo District in PLE for 2005-2007. The study
was correlational because it involved correlating the independent variable
(i.e. nature of schools and dependent variables, pupils' academic performance).
3.2. Research Population
All the P.6 leavers 2005-2007, head teachers, and teachers of
upper primary level from 80 primary schools of Gasabo District constituted the
population for the study.
3.3.
Sample and Sampling Procedures
Using a stratified random sampling, out of 80 primary schools,
10 primary schools were chosen and the choice was based on the status of the
school (government funded or not), therefore five schools were government
funded (public schools or private subsidized schools) and five were private.
From each of the 10 sampled schools 30 best performing students at the PLE
2005-2007 selecting 10 pupils from each of the three years, making a total
sample of 300 pupils. Again, using the same sampling technique, 4 teachers (2
males and 2 females) from each of the selected primary schools were chosen in
accordance with the initials of their surnames in ascendant order to be
interviewed about their school facilities and their teaching as well as about
their motivation towards their job; every head teacher of the selected school
was also interviewed. So apart from 300 pupils whose marks were analyzed, also
50 teaching personnel (Teachers and head teachers) were also selected to be
part of the sample. Thus the total sample of all respondents was 350.
Table3. 1: List of 10 Schools
Selected and Number of People Taken in Sample
|
Private Primary Schools
|
Code in the research
|
Number Pupils in Sample
|
Number of Teachers/
Head teachers in Sample
|
Public Primary Schools
|
Code in the research
|
Number Pupils in Sample
|
Number of Teachers/Head teachers in Sample
|
|
Teachers
|
Head teachers
|
Teachers
|
Head teachers
|
|
E.I.K (Ecole Internationale de Kigali
|
AA
|
30
|
4
|
1
|
Gisozi I
|
A
|
30
|
4
|
1
|
|
Green Hills Academy
|
BB
|
30
|
4
|
1
|
Kacyiru I
|
B
|
30
|
4
|
1
|
|
Kigali Parents' School
|
CC
|
30
|
4
|
1
|
Kagugu
|
C
|
30
|
4
|
1
|
|
Ecole La Colombière
|
DD
|
30
|
4
|
1
|
Remera Catholique I
|
D
|
30
|
4
|
1
|
|
L'Horizon
|
EE
|
30
|
4
|
1
|
Remera Catholique II
|
E
|
30
|
4
|
1
|
|
150
|
20
|
5
|
|
150
|
20
|
5
|
Source : Primary Data
3.4.
Instruments
In this study, there was a need to use both primary and
secondary data. For primary data, the tools which were used include
questionnaires, interview guide, and Inventory form. For secondary data it was
necessary to read the results of PLE 2005- 2007 of primary schools taken into
the sample. The relevant literature was also consulted for the purpose of this
study.
3.4.1.
Interview Guide
The interview concerned head teachers or their deputies where
head teachers were not available on the day of interview. The interview guide
that was used in this research was structured (i.e. it was based on
pre-established elements of which the informants were required to take into
account when responding). It included 15 questions related to teaching quality
as well as school quality in general.
3.4.2.
Questionnaire
Questionnaire included only alternative questions where the
respondent had to choose only from the alternative levels using the Likert
scale ranging from 1 for strongly disagree to 5 for strongly agree. The
questionnaire was made up of 10 questions related to the factors affecting the
academic performance of pupil availability and adequacy of educational
resources and their impact on pupils' academic performance; and the teachers'
general opinion about their profession. Questionnaires were distributed to Head
Teachers and 4 teachers of upper primary level in every selected primary
school. And the researcher had to pick them after 7 days.
3.4.3.
Inventory form
This tool helped the researcher to evaluate the availability
and adequacy of educational resources at each school and the general school
environment. It was made up of 31 items grouped into 4 categories of
educational resources: Physical, material, human and financial.
3.5.
Validity and Reliability
To test the validity and liability of the data collection
instrument a pre-test on the field and a pre- coding were done to measure the
applicability of the research instruments and the results they would generate.
The pre-test was done in Huye District in Southern Province of Rwanda and it
concerned four primary schools, two were private and two public. Its results
guaranteed the quality assurance at 80% as 16 out of 20 respondents repeated
almost the same answers.
3.6.
Data Analysis
The data were analyzed using summary statistics involving
frequency tables showing categories and percentages. At bi-variate level
Student's T-test was used to find out whether there is a significant difference
between performance of pupils of public primary schools and that of their
counterparts of private primary schools. To measure the availability and the
adequacy of school resources in public primary schools and in private primary
schools, there was an appreciation based on figures between demand and supply
of every item concerned. Items were made up of various educational resources
required by any school for better education. The relationship between teacher
quality and pupils performance was analyzed qualitatively using the data
provided by head teachers using the interview method.
3.7.
Ethical Consideration
Before the data collection from the field, the researcher
sought for permission and clearance from all the relevant authorities
especially the Mayor of Gasabo District, and The Director of Education, Youth,
Culture and Sports of Gasabo District.
All the information from respondents was used for only the
academic purposes and all respondents were told to keep anonymity on the
questionnaires. The anonymity was also kept on interview schedules. Only codes
were used to differentiate respondents and interviewees, like School A, Teacher
B etc.
3.8.
Limitations of Study
There was reluctance of some key informants which was assumed
to be a result of their limited understanding of the research topic or to
weakness found in their school administration. It is usually known that most
people do not like to disclose their weak side. Some informants did not have
enough time to fill questionnaires and/or inventory forms in that case, the
researcher was obliged to interview them and to complete questionnaires and/or
forms in their place. Some respondents tried to give wrong information in order
to cover their weakness for example lack of some important educational
facilities. To minimize on the limitation of inadequate understanding of the
topic the researcher made an effort to explain to the respondents what the
research is all about and to control the problem of fear to disclose the weak
points of the schools the researcher assured respondents of anonymity
CHAPTER FOUR
DATA
PRESENTATION, ANALYSIS AND INTERPRETATION OF DATA
4.1.
Overview
This chapter deals with presentation, analysis and
interpretation of collected data. The presentation, analysis and interpretation
were concerned with the comparing academic performance of pupils in public and
private primary schools, the relation between teacher quality and pupils
academic performance as well the relationship between school facilities and
pupils academic performance in Gasabo district.
4.2
Background of the Respondents
This section gives the distribution of respondents by category
(i.e. Teachers, head teacher and pupils), sex, age, qualification and
experience.
Category of respondents
Table 4.1 gives the distribution of respondents by category
Table 4.1 Respondents by category
|
Category
|
Number
|
Percentage
|
|
Teachers
|
40
|
11.0
|
|
Head teachers
|
10
|
3.0
|
|
Pupils
|
300
|
86.0
|
|
Total
|
350
|
100.0
|
Table 4.1 reveals that pupils contributed the biggest
percentage (85%) of the respondents and head teacher contributed the lowest
(3.0%)
Sex of the Respondents
Table 4.2 gives the distribution of staff respondents by sex
Table 4.2 Sex categories
of staff
|
Category
|
Number
|
Percentage (%)
|
|
Females
|
18
|
36
|
|
Males
|
32
|
64
|
|
Total
|
50
|
100.0
|
Table 4.2 show that among the
staff that participated in the study (i.e. teachers and head teachers) males
dominated the sample by contributing 64% of the respondents suggesting their
large number in the schools of the study area.
Qualification of respondents
The distribution of the staff by qualification is
reported in Table 4.3
Table 4.3 Respondents by Qualification
|
Age group
|
Number
|
Percentage (%)
|
|
A Level certificate
|
35
|
70
|
|
Diploma
|
7
|
14
|
|
Degree
|
8
|
16
|
|
Total
|
50
|
100.0
|
According to table 4.3, the majority (70%) of the respondents
were A' level certificate holders (out of whom 22 were from public schools and
13 from private school) while degree holders were slightly above diploma
holders with 16% and 14% respectively. Out of the 8 degree holder 3 were from
public schools and 5 from private schools. All the seven diploma were from
private schools. The finding suggests that A level certificate holders
dominated the sample.
Working experience of respondents
Table 4.4 gives the distribution of respondents by
working experience.
Table 4.4 Respondents by working experience
|
Working experience
|
Number
|
Percentage (%)
|
|
0 - 5
|
29
|
58
|
|
6 - 10
|
9
|
18
|
|
10 and above
|
12
|
24
|
|
Total
|
50
|
100.0
|
The study findings in table 4.4 suggest that majority of the
respondents (58%) had experience of five years and less followed by those with
experience of (10 years and above and those of (6 -10) constituted 24% of the
teaching staff and head teachers.
4.2 Comparison of pupils' academic
performance in public and private and private primary schools in Gasabo
District.
The first objective of the study was to compare the
performance of pupils in public and private primary schools in Gasabo district
Rwanda from which it was hypothesized that, there is no significant difference
in performance of pupils in public and private primary schools in Gasabo
district Rwanda. To test this hypothesis two sample t-tests was used. Table
4.5 show descriptive statistics and t-test result.
Table 4.5: Two-Tailed t-Test for the Difference in
Pupils' Performance between Public and Private Primary
Schools
|
Type of school
|
Sample size
|
Mean
|
SD
|
t-calculated
|
Sig. or P value
|
Decision
|
|
Public schools
|
150
|
61.07511
|
65.40607
|
2.290
|
1.645
|
Reject HO1
|
|
Private schools
|
150
|
73.4
|
10.71423
|
The hypothesis tested was Ho1: There is no
significant difference in the academic performance of pupils in private and
public primary schools of Gasabo district.» Considering the results in
table 4.5, the P value is 1.4966E-24 or 1.4966x10⁻²⁴ Since the P.
value is below 0.05, there is a significant difference between the two
distributions. This leads to the rejection of the H0, implying that
there is a significant difference in academic performance between pupils in
private primary schools and public primary schools of Gasabo district. This is
also confirmed by the value of t. t-cal. 2.290 >t-critical 1.645.
4.3 School Facility Availability and Pupils Academic
Performance
The second objective of the study was to establish the
relationship between school facility availability and students academic
performance. The study also intended to establish how available and adequate
are educational resources in private and public primary schools of Gasabo
District? Data was collected using an observation check list and the findings
are presented in table 4.6 and 4.7
Table 4.6 Resource Demand and
Supply in 5 Selected Private Primary Schools of Gasabo District
|
Resource
|
School name
|
AA
|
BB
|
CC
|
DD
|
EE
|
|
Items
|
Dds*
|
Spls*
|
Dds
|
Spls
|
Dds
|
Spls
|
Dds
|
Spls
|
Dds
|
Spls
|
|
Physical
|
Offices
|
3
|
3
|
3
|
3
|
4
|
4
|
2
|
2
|
3
|
2
|
|
Classrooms
|
22
|
22
|
42
|
42
|
38
|
38
|
52
|
40
|
20
|
20
|
|
Toilets
|
30
|
20
|
42
|
42
|
32
|
32
|
24
|
24
|
30
|
25
|
|
Classrooms
with electricity
|
20
|
20
|
42
|
42
|
42
|
42
|
40
|
40
|
20
|
20
|
|
Playgrounds
|
3
|
2
|
4
|
3
|
4
|
3
|
4
|
2
|
3
|
1
|
|
Laboratory
|
1
|
0
|
1
|
1
|
1
|
1
|
1
|
0
|
1
|
0
|
|
Clinical room
|
1
|
0
|
1
|
1
|
1
|
1
|
1
|
1
|
1
|
0
|
|
Craft room
|
1
|
0
|
1
|
1
|
1
|
1
|
1
|
1
|
1
|
0
|
|
Staff room
|
1
|
0
|
1
|
1
|
1
|
1
|
1
|
1
|
1
|
1
|
|
Library
|
1
|
0
|
1
|
1
|
1
|
1
|
1
|
1
|
1
|
0
|
|
Computer room
|
1
|
0
|
1
|
1
|
1
|
1
|
1
|
1
|
1
|
0
|
|
Material
|
Chairs
|
30
|
25
|
72
|
72
|
75
|
65
|
70
|
56
|
28
|
24
|
|
Tables
|
24
|
18
|
56
|
56
|
68
|
68
|
60
|
50
|
24
|
19
|
|
Suitable desks
|
330
|
330
|
678
|
678
|
556
|
556
|
800
|
750
|
363
|
365
|
|
Projectors
|
1
|
0
|
2
|
2
|
2
|
2
|
1
|
0
|
1
|
0
|
|
Text Books &other reading materials
|
700
|
500
|
5000
|
3875
|
5000
|
4510
|
1500
|
1400
|
1235
|
849
|
|
Computers
|
10
|
3
|
80
|
63
|
70
|
52
|
50
|
40
|
25
|
2
|
|
Computers with internet connection
|
3
|
1
|
45
|
45
|
25
|
20
|
40
|
5
|
3
|
1
|
|
Printer
|
1
|
1
|
1
|
1
|
1
|
1
|
1
|
1
|
1
|
1
|
|
Maps
|
10
|
8
|
25
|
25
|
20
|
20
|
6
|
6
|
14
|
7
|
|
Charts
|
52
|
52
|
48
|
48
|
43
|
43
|
30
|
18
|
40
|
21
|
|
TVs
|
2
|
1
|
2
|
2
|
2
|
2
|
1
|
0
|
1
|
0
|
|
Radios
|
2
|
1
|
3
|
3
|
4
|
4
|
2
|
1
|
2
|
1
|
|
School buses
|
5
|
0
|
2
|
2
|
3
|
2
|
3
|
0
|
2
|
1
|
|
Photocopier
|
1
|
1
|
2
|
2
|
2
|
1
|
1
|
1
|
1
|
1
|
|
Human
|
Enrolment
|
550
|
550
|
1468
|
1468
|
1111
|
1111
|
1200
|
1039
|
760
|
726
|
|
Class size
|
25
|
25
|
35
|
35
|
29
|
29
|
30
|
28
|
38
|
36
|
|
Qualified Teachers
|
24
|
24
|
46
|
46
|
50
|
50
|
42
|
42
|
20
|
20
|
|
Counseling officers
|
1
|
0
|
1
|
1
|
2
|
1
|
1
|
0
|
1
|
0
|
|
School nurses
|
2
|
0
|
2
|
2
|
2
|
1
|
2
|
1
|
2
|
0
|
|
Administrators
|
7
|
7
|
6
|
6
|
4
|
4
|
7
|
7
|
4
|
2
|
|
Supporting Staff
|
4
|
3
|
14
|
14
|
7
|
7
|
16
|
16
|
3
|
2
|
|
Financial
|
Budget
|
Not revealed
|
Not revealed
|
Not revealed
|
Not revealed
|
Not revealed
|
Not revealed
|
300,000,000frw
|
187,000,000frw
|
Not revealed
|
Not revealed
|
*Dds: Demands; *Spls: Supplies
NB: The inventory in table 4.6 is of academic year 2009.
The tables 4.4 and 4.7 show that the inventory of educational
resources in selected schools comparing the figures in the demand and supply
columns. In general, private primary schools have reached or were about to
reach in supply column what was stated in demand column. However, for some few
items, even private primary schools did not attain a satisfactory degree of
supplying themselves what they had stated in demand column. This is the case of
items like: staff room, craft room, clinical room, projectors, counseling
officer, school bus and school nurse where two out of the 5 selected private
schools did not get any of those resources while they consider them necessary
for the education of their pupils. For laboratory, only two out of 5 private
primary schools have managed to have one each. For the rest of items, private
primary schools of Gasabo have relatively acquired a satisfactory level of
availability and adequacy of educational resources.
In contrast, the public primary schools selected did not reach
required educational resources they aspired as there is a very significant gap
between their demands and their supplies. Even for the basic educational
resources like books, classrooms, maps, charts public primary school selected
showed a big gap between the demands and the supplies. As other items are
concerned, for example, enrolment, classrooms and teachers, the situation is
worse. In fact, willing to implement the UPE and EFA principles, public primary
schools of Rwanda in general ( and those of Gasabo are included) enroll very
many pupils while educational resources remain very few. The number of teachers
doesn't increase as the enrolment increases too. This causes a high
pupils-teacher ratio and a big class size.
In all 5 private primary schools selected, pupils follow the
system called `going unique' commonly known as `gonginike' in Kinyarwanda
whereby they study from 7h30 am to 1h30 pm and go home for coming back to
school the following day. In this system, the classroom is used by only one
class and teacher is supposed to spend the same number of hours at school as
his/her class. But in all 5 public primary schools selected as in all public
primary schools of Rwanda the system practiced is called `double shift' whereby
one classroom is used by two classes on the same day. The first group uses the
morning and goes home to come back to school the following day in afternoon
while the group that comes in afternoon today will come back to school tomorrow
in the morning. However, teachers remain the same. This means that a public
primary teacher teaches two classes on the same day and so he doubles the
number of hours spent by each of his/her classes.
As computers and internet connection are concerned, even
though the availability and adequacy of these resources are not well
distributed among private primary schools, the number of computers per school
varies between 3 to 80 computers and there is at least one computer connected
to internet. In 5 public primary schools selected, the number of computers per
school varies between 2 and 18 computers and only one public school has access
to internet with 18 computers all connected. All the other 4 do not have
internet connection. This means that they cannot access online educational
resources while in all private primary schools; the online resources are
commonly utilized for the best quality of education they deliver. However, in
the inventory, children's personal computers were not counted as they are not
part of the schools' property (through the project named `one laptop per child'
a good number of children especially in Kigali City have their own laptops
which they acquire at a very low price with a certain sponsorship of the
government and these are adapted to primary school children with special
software designed to teach Sciences and Geography).
As the financial resources are concerned, only one of the 5
private schools selected accepted to reveal to the researcher the budget they
expected to use in 2009 and what they actually used. Other private primary
schools refused to reveal their budgets and there could not be any other
mechanism to be used by the researcher to be aware of those budgets. However,
the equilibrium which tends to be between demands and supplies in other
educational resources in those private primary schools can allow the researcher
to believe that there tends to be equilibrium between the demand and the supply
in financial resources in these schools. It is important to note that the
salaries of teachers and other staff members are deducted from the same budgets
too in private schools.
In public primary schools, the budgets mentioned in the
inventory are used to purchase some basic educational resources and to pay
teachers' bonuses as their salaries are paid by the central Government.
However, those budgets are still insignificant as the gap between their demands
and their supplies is still great.
The figures in the inventory of educational resources allowed
the rejection of the second hypothesis which said: `There is no significant
difference in availability and adequacy of school resources between private and
public primary schools of Gasabo district' and hence, there is a significant
difference in availability and adequacy between private and public primary
schools of Gasabo. Educational resources are more available and adequate in
private than in public primary schools of Gasabo District.
Table 4.7 Resource Demand and
Supply in 5 Selected Public Primary Schools of Gasabo District
|
Resource
|
School name
|
A
|
B
|
C
|
D
|
E
|
|
Items
|
Dds
|
Spls
|
Dds
|
Spls
|
Dds
|
Spls
|
Dds
|
Spls
|
Dds
|
Spls
|
|
Physical
|
Offices
|
3
|
1
|
3
|
1
|
3
|
2
|
3
|
1
|
3
|
1
|
|
Classrooms
|
36
|
33
|
38
|
30
|
42
|
42
|
25
|
21
|
15
|
11
|
|
Toilets
|
70
|
42
|
25
|
25
|
40
|
36
|
20
|
12
|
27
|
27
|
|
Classrooms
with electricity
|
33
|
2
|
30
|
5
|
42
|
42
|
25
|
15
|
11
|
11
|
|
Playgrounds
|
4
|
2
|
4
|
1
|
4
|
0
|
4
|
1
|
4
|
2
|
|
Laboratory
|
1
|
0
|
1
|
0
|
2
|
1
|
1
|
0
|
1
|
0
|
|
Clinical room
|
1
|
0
|
1
|
0
|
1
|
0
|
1
|
0
|
1
|
0
|
|
Craft room
|
1
|
0
|
1
|
0
|
1
|
0
|
1
|
0
|
1
|
0
|
|
Staff room
|
1
|
0
|
1
|
0
|
1
|
0
|
1
|
1
|
1
|
1
|
|
Library
|
1
|
0
|
1
|
1
|
1
|
1
|
1
|
0
|
1
|
0
|
|
Computer room
|
1
|
0
|
1
|
0
|
1
|
1
|
2
|
1
|
1
|
0
|
|
Material
|
Chairs
|
40
|
30
|
40
|
30
|
120
|
69
|
50
|
30
|
27
|
27
|
|
Tables
|
40
|
20
|
36
|
33
|
70
|
40
|
40
|
30
|
20
|
20
|
|
Suitable desks
|
1375
|
575
|
800
|
722
|
966
|
800
|
600
|
500
|
475
|
330
|
|
Projectors
|
1
|
0
|
2
|
0
|
1
|
1
|
2
|
0
|
2
|
0
|
|
Text Books &other reading materials
|
3500
|
1800
|
6000
|
3992
|
6000
|
3650
|
2000
|
1500
|
4136
|
3386
|
|
Computers
|
10
|
0
|
30
|
2
|
31
|
18
|
50
|
7
|
30
|
2
|
|
Computers with internet connection
|
10
|
0
|
2
|
0
|
31
|
18
|
7
|
0
|
2
|
0
|
|
Printer
|
1
|
1
|
1
|
1
|
1
|
1
|
1
|
1
|
1
|
1
|
|
Maps
|
30
|
4
|
25
|
2
|
30
|
10
|
25
|
10
|
10
|
10
|
|
Charts
|
30
|
2
|
46
|
14
|
50
|
25
|
30
|
10
|
20
|
20
|
|
TVs
|
1
|
0
|
3
|
0
|
1
|
0
|
1
|
0
|
1
|
0
|
|
Radios
|
3
|
1
|
3
|
0
|
1
|
0
|
2
|
1
|
1
|
0
|
|
School buses
|
2
|
0
|
2
|
0
|
0
|
0
|
2
|
0
|
2
|
0
|
|
Photocopier
|
1
|
0
|
2
|
1
|
1
|
0
|
3
|
2
|
1
|
1
|
|
Human
|
Enrolment
|
2750
|
3190
|
2423
|
2514
|
3500
|
3684
|
1660
|
1724
|
900
|
950
|
|
Class size*
|
38
|
48
|
32
|
42
|
42
|
44
|
33
|
41
|
30
|
43
|
|
Qualified Teachers
|
44
|
44
|
45
|
42
|
51
|
48
|
29
|
29
|
15
|
15
|
|
Counseling officers
|
1
|
0
|
2
|
0
|
2
|
0
|
2
|
0
|
1
|
0
|
|
School nurses
|
1
|
0
|
2
|
0
|
1
|
0
|
2
|
0
|
1
|
0
|
|
Administrators
|
3
|
2
|
3
|
1
|
3
|
2
|
3
|
1
|
3
|
1
|
|
Supporting Staff
|
4
|
3
|
2
|
1
|
5
|
3
|
4
|
2
|
3
|
2
|
|
Financial
|
Budget
|
29625000rwf
|
27115000rwf
|
15565299rwf
|
13573900rwf
|
42875000rwf
|
30458000rfw
|
28482500rwf
|
10912800rwf
|
15043260rwf
|
13500000rwf
|
Regarding the relationship between school resource
availability and pupils' academic performance data collected through the
questionnaires to teachers and interviews to the head teacher revealed a
relation between the two variables in all the two categories of schools. The
study established that resource availability (in terms of physical, human and
financial) positively affect pupils' academic performance. Teachers and head teachers of both public and private
primary school of Gasabo agree at the extent of 80% that the academic
performance in their schools is generally the result of school facilities and
hard work. But on the availability and adequacy of the general climate of the
school, a big gap is realized between the views of private and public primary
school teachers and head teachers.
On the collaboration of parents/guardians with the school for
better education of their children, it was realized that in private primary
schools this collaboration is very high (84%) while in public primary schools,
it is too low (8%). Asked whether school Social Climate was conducive i.e. the
status of their school vis-à-vis teacher satisfaction with school
structure, parental involvement, differentiation in student programs,
principal's report of time devoted to instruction, and open versus closed
classroom; 72% of teachers and head teacher in private primary schools ticked
`yes' versus only 24% of their counterparts of public primary schools. This
shows that teachers and head teachers of public primary schools of Gasabo are
generally dissatisfied with their school social climate and this is very
dangerous vis-à-vis their own work performance and obviously pupils
academic performance.
On the question whether pupils receive the feedback of their
home works and quizzes quickly and regularly, 96% of respondents from private
schools ticket `yes' versus 16% of public primary schools who ticked `yes' too.
This shows that in public primary schools, teachers delay to (or do not) give
feedback to their pupils as home works or quizzes are concerned while the
regular and quick presentation of such feedback could constitute a source of
motivation to pupils. Teacher turnover is experienced at 44% in public primary
schools versus 8% in private primary schools.
Teachers are involved in decision making on issues related to
teaching/learning process at the extent of 64% in public primary schools versus
24% in private primary schools of Gasabo. This shows that in public primary
schools, teachers are given a chance to decide on how and what to teach while
in private primary schools this chance is too small. Asked whether their
respective school's environment favor the teaching/learning process, only 44%
of respondents in public primary schools ticked yes versus 92% who ticked yes
too in private primary schools. This means that, teachers and head teachers of
private primary schools of Gasabo are more satisfied with the environment they
work in than their counterparts of public primary schools.
Class sizes were also identified as determinants of academic
performance. Studies have indicated that schools with smaller class sizes
perform better academically than schools with larger class sizes. Kraft (1994)
in his study of the ideal class size and its effects on effective teaching and
learning in Ghana concluded that class sizes above 40 have negative effects on
students' achievement. Asiedu-Akrofi (1978) indicated that since children have
differences in motivation, interests and abilities and that they also differ in
health, personal and social adjustment and creativity generally good teaching
is best done in classes with smaller numbers that allow for individual
attention.
4.4 Teacher Quality and Pupils Academic Performance
The third objective of the study was to establish the
relationship between teacher quality and pupils' academic achievement, from
which a research question was developed that, is there a significant
relationship between teacher quality and pupils' achievement. Teacher quality
in this study was conceptualized in terms of preparation for class, teacher
commitment, managing and monitoring pupils learning and teacher experience.
Data was collected through questionnaires and interviews and analyzed
qualitatively. According to the findings of the study it was established that
teacher quality significantly affect pupils performance in private and public
primary schools in Gasabo district. It was pointed out by the respondents that
prepared teachers adequately deliver in class and thus makes pupils understand
the lesson content which positively influence their performance. The
respondents also revealed that experience help the teacher to deal with many
situations, to have an understanding of the pupils' needs and to cater for
them, as well as creating a conducive environment for learning. Thus generally
teacher quality was taken to affect performance.
CHAPTER FIVE
FINDINGS, CONCLUSIONS,
RECOMMENDATIONS
5.1. Introduction
This chapter presents the discussion of the major findings, in
relation with the background and literature review. The researcher's personal
views are also included arising from statistical inference, observation and
interpretation of situations encountered during the study. The conclusions are
given based on the findings and consequently, recommendations were made based
on the conclusions. Other areas for further researches have also been indicated
at the end of this chapter.
5.2. Findings
Difference in performance between private and public primary
schools
The outcome of the analyzed data showed that there is a
significant difference between the academic performance of pupils of private
and public primary schools. The findings confirm what was found by Afolabi
(2005) in his study which examined the influence of a specified primary school
education experience on the academic performance of junior secondary students
I, in Methodist Grammar School, Bodija. This Nigerian scholar realized that
students who had private school background outperformed their counterparts who
attended public primary schools in English and Mathematics. These findings
answer the first research question by showing that private primary schools of
Gasabo District perform better than public primary schools.
These findings seem to discredit, to some extent, the standard
of education in the public schools since their products could not compete
favorably with the products of the private schools. This may be flashing the
danger light as regards the future of the next generation of elders and the
fate of education industry in Rwanda. The anticipated future problem becomes
more evident when one considers the proportion of the Rwandan people living
below the poverty line vis-à-vis the financial involvement of sending
one's child to the private schools where resources are available and adequate,
and where pupils and teachers are motivated and where finally, good academic
performance is expected from.
School facility and academic performance
The outcome of this study also showed that in private primary
schools resources are more available and adequate than in public primary
schools. Firstly, the inventory of educational resources in private and in
public primary schools has shown that there is a big gap between the demands
and the supplies of educational resources in public primary schools of Gasabo
while this gap is very little in public and seems to be inexistent in private
primary schools. These results allowed the rejection of Ho.2 and hence to state
that in private primary schools resources are more available and adequate than
in public private schools'. The important effects of inadequacy or lack of
educational resources are lack of motivation, tiresome teaching and learning,
inattention to individual learners, high rate of school dropout, low quality of
teaching and learning etc. which cause finally the poor academic
performance.
Secondly, in testing the degree of the difference between
teachers and head teachers' views on the effects of inadequate educational
resources on academic performance, the results showed that teachers and head
teachers of private primary schools of Gasabo are more proud to work in their
school environment than their counterparts of public primary schools. They also
showed that they are generally satisfied with how their pupils learn and how
they are evaluated. However, in public primary schools, there is a big gap
between what teachers and head teachers wish to deliver as education to their
pupils and what they actually deliver because of very limited educational
resources.
When the difference in academic performance is compared to the
difference in availability and adequacy of school resources in both private and
public primary schools of Gasabo district, it becomes clear that both adequate
supply of good teachers and school resources greatly influenced students'
academic performance in PLE. These results confirmed the views of some writers
like Fafunwa (1979), Fagbamiye (1977), Fayemi (1991), Moronfola (1982), Momoh
(1980) and Popoola (1981).
From the above findings and the ideas ad hoc; enrolling one's
child in private primary school predicts his/her good future as there is no
doubt that the private school proprietors pay more attention to their teacher's
input into the pupils than do the public schools (Salawu & Adedapo, 2001).
They also spend substantial amount of money to provide instructional materials
for the teaching and learning process. They take their students out on
fieldtrip, excursions and so on, which are not obtained in most public schools.
Unless the political leaders pay attention on this gap between private primary
schools and public primary schools, the segregation in education will continue
to prevail while the government of Rwanda created RNEC aiming to establish a
body that would eradicate at all costs all forms of discrimination in the
education system and establish on objective, fair, transparent system in which
the main indicator for equity in education system is the individual performance
level and the right of choice to any school or institution on Rwanda. In
accordance to the difference in performance realized between pupils of private
and those of public primary schools, and to the economic level of most
Rwandans, the right to good quality may not be accessed as only well - to - do
Rwandans may manage to enroll their children in quality schools that is
enrolling them into private primary schools. For sure it is what is done by
rich people and high ranked officials of Rwanda even those of the Ministry of
Education.
To increase the provision of adequate material resources for
the teaching of all subjects is much recommended. It is opined that human,
physical and financial resources do not necessarily make much difference in
terms of pupils' learning outcome. It is the efficient use of these resources
and not just the availability that matters. It is therefore recommended that
the resources made available to the primary schools should be efficiently
utilized and the school environment should be made conducive for learning in
order to improve pupils' learning outcome.
The study findings established a relationship between teacher
quality and pupils' academic achievement in Gasabo and this finding relate with
a wide range of findings on the relationship between teacher quality in and
student outcomes. Hanushek (1986) found that fewer than half of the 109
previous studies on the estimated effects of teacher quality showed that
quality had any statistically significant effect on student achievement; of
those, 33 studies found that other factors were also had a significant
positive effect, but seven found that more experience actually had a negative
impact on student achievement. Other studies show a stronger positive
relationship between teacher quality and student outcomes in some, but not all,
cases they reviewed (e.g., Greenwald et al., 1996). Murnane (1995) suggests
that the typical teaching learning curve peaks in a teacher's first few years
(estimated at year two for reading and year three for math). It is also
plausible that a positive finding on quality actually results from the tendency
of more senior teachers to select higher-level classes with higher achieving
students (Hanushek, 1986). Thus we might reasonably infer that the magnitude of
the quality effect, should it exist, is not terribly large.
5.3. Conclusion
On the basis of the discussion of the findings on each of the
objectives the following conclusions were made.
The pupils of private primary schools of Gasabo perform better
than their counterparts of public primary schools in PLE. This doesn't come
randomly, as they are well prepared from the early first classes. Though having
the teachers of almost the same qualification, and pupils of almost the same
background, private primary schools motivate more their teachers and their
pupils than public primary schools do through various ways: good pay to
teachers, small classes, good working environment, conducive environment for
learning (availability and adequacy of school resources), regular evaluations,
good collaboration between school and parents/guardians, guidance and
counseling services made operational, excursions etc.
Educational resources (human, physical, material, and
financial) are more available and adequate in private primary schools than in
public ones; while these resources should be made available to the school to
create conducive climate to produce desirable outcomes. (Heneveld 1994;
Heneveld & Craig 1995). The lack of some necessary facilities in public
primary schools is justified by the financial resources which are very few due
to the lack of variety of funding sources. These schools are only funded by the
government through the annual budget (but for the case of private subsidized
schools, there may be another funding source, though irregular that is the
founder of the school e.g. a church) while private primary schools have
alternative sources of funding. They can raise tuition, and they also can raise
significant amounts of money from a variety of development activities,
including annual appeals, cultivation of alumni and alumnae, and solicitation
of grants from foundations and corporations. The strong allegiance to private
schools by their alumni makes the chances of fund-raising success a real
possibility in most cases. And this allows them to supply themselves with
required facilities at any cost.
There is good collaboration between private primary schools
and parents/guardians of pupils for their best education while in public
primary schools such collaboration is too little.
In Rwanda, children of high ranked politicians and other
officials are more enrolled in private primary schools than in public primary
schools. This gives a view that even politicians and these other officials
recognize the low quality of public primary schools in comparison to private
ones.
On the third objective, the study concluded that teacher
quality has a bearing on pupils' academic performance and that pupils studying
in private schools where teachers have quality exhibited in terms of their
academic proficiency and experience tend to perform better than pupils in
public schools where teachers are mainly A' level certificate holders,
5.3. Recommendations
On the basis of the above findings and conclusions, the
following recommendations were made
The government of Rwanda should do its best to provide public
and private subsidized primary schools with required facilities so as to create
in them a welcoming environment for teaching/learning process by treating
teachers humanly (giving them reasonable salaries, treating them as other civil
servants so that they cease to take the teaching career as a transition while
they are searching good jobs),
The Ministry of education should reduce the bureaucracy in the
school administration, allowing public schools to diversify their sources of
funding, providing public primary schools with staff in charge of guidance and
counseling and increasing the number of teachers and classrooms to reduce the
pupils-teacher ratio, as this would also contribute to close the segregation in
education based on the choice of quality school where to enroll one's child
(poor parents/guardians are forced to enroll their children in public schools
because private schools are expensive).
Politicians and other officials of Rwanda should also keep
monitoring and evaluating the quality of public education in primary schools
and take general decision in favor of all citizens of Rwanda instead of taking
individual decisions of enrolling their own children into private primary
schools (as they have financial means) because they realize the low quality of
public primary schools.
The RNEC should conduct a study on the factors of performance
in PLE and use its results to advise the government and to revise the way PLE
are prepared and administered if not, it will keep saying that it combats
segregation in education at all cost while it contributes to increase it by
giving the same test to pupils while their studying conditions have not been
the same.
Teachers and head teachers of public primary schools should
use the resources available in their respective schools efficiently to increase
the performance of their pupils in general and in PLE in particular.
Parents and guardians should collaborate regularly with the
public primary schools for better education of their children by helping
children correct their home works, giving them enough time at home to revise
their notes, hiring private monitors for them where it is possible, visiting
them regularly at school to know how they progress in learning and their
discipline at school.
The value of a teacher's quality in terms of experience,
qualification, ability to prepare for lessons should be honored and compensated
in order to give teachers the motivation to adequately do their jobs and
support pupils learning to improve on their performance.
5.4. Suggestions for Further
Research
The researcher suggested the following areas for further
research:
· The relationship between educational resources and
pupils' academic performance in primary schools of Rwanda;
· The role of parents/guardians' collaboration with
primary schools in the academic performance of pupils.
· Determinants of pupils' performance in public primary
schools in Rwanda
REFERENCES
Adeosun, V.O., (2001). The RelativeEfficacy of Pictures
and Realia in the Teaching of Verbs in Junior Secondary Schools. UNAD. J.
Edu., 2: 50-56.
Afolabi A. O. (2005). Comparison of Private and Public School
Products' Performance in Mathematics and English Language from Educational
Technology Perspective. In Ilorin Journal of Education Retrieved at
http://www.unilorin.edu.ng/unilorin/journals/education/ije/aug2005/
Ajayi, I.A. And E.O. Ashaolu, (2002). Relationship between
Availability of Resources and Students' Academic Performance in Pre-Vocational
Subjects in Junior Secondary Schools in Ondo West Local Government Area of Ondo
State. J. Edu. Innovat. Dev., 1:247-253.
Ajayi, I.A., (1999). Unit Cost of Secondary Eduction and
Students'Academic Achievement in Ondo State, Nigeria (1991-1995). Ph.D.
Thesis University of Ibadan, Ibadan.
Ajayi, I.A., (2002). Resource Factors as Correlates of
Secondary Schools Effectiveness in Ekiti State. Nigerian J. Counseling
and Applied Psychol.1:109-115.
Ajayi, I.A.,2(007). Issues in School Management.
Ikeja,Lagos:Bolabay Publications.
Akpa, S.U udoh and E.O. Fagbamiye (Eds), Deregulating the
Provision and Management of Education in Nigeria. Jos: The Nigerian
Association for Education Administration and Planning (NAEAP).
Angrist, Joshua D. and Victor Lavy. (1999). «Using
Maimonides' Rule to Estimate the Effect of Class-size on Scholastic
Achievement.» The Quarterly Journal of Economics, 114(2), pp.
533-575.
Armentano, Dominick. (2003). «Let's Re-think Class-size
Amendment.» Cato Institute, Washington D.C. Retrieved at
http://www.cato.org/cgi-bin/scripts/printtech.cgi/dailys/08-10-03.html
accessed on 17.06.09
Asiedu-Akrofi, K. (1978). School Organisation in Modern
Africa. Tema : Ghana Publishing
Corporation.
Ausubel, D. P. (1973). The Psychology of Meaningful Verbal
Learning. New York, NY:
Harvard University Press.
Australian College of Educators, [Undated]. What
Makes a Good School? Retrieved at http//www.austcolled.com.au accessed on
13.03.2009
Ayodele, J.B, (2005). Fundamentals of Systems analysis in
Education. Ikeja ,Lagos: Balabay Publications.
Balogun, J.A. (1995). Resource Allocation as it affects
Teaching and Learning in Government Technical Colleges: a Case of Two Technical
Colleges in Oyo state of Nigeria. Unpublished M. Ed. Thesis. University of
Ibadan, Ibadan.
Broom, L. (1973). Sociology: A text with Adopted Reading (4th
ed.). New York: Harper and Row.
Case, Anne, and Angus Deaton. (1999). «School Inputs and
Educational Outcomes in South Africa.» The Quarterly Journal of
Economics, 114(3), pp. 1047-1084.
Chaudhury et al. (2000) Absence of teachers and health
workers: in selected
developing countries: Journal of Education Research India
Chike-Okoli, A. and P.S Sarki, (2005). Influence of Physical
Classroom Environment on Academic Performance in Public and Private Schools,
in: G.O.
Cohen et al., (2000). Research Methods in education.
5th edition, Rutledge Falmer 11 New Fetter Cane; London.EC4 PCEE.
Coombs, P.H. (1970). The World Educational
Crisis: A system Analysis. New York. Oxford University Press.
Darling-Hammond, L. 2000. «Teacher Quality and Student
Achievement: A Review of State Policy Evidence.» Educational Policy
Analysis Archives, 8(1).
Economics
of Education Review
Volume
20, Issue 4, August 2001, Pages389-399 available at
http://www.sciencedirect.com/science/journal/02727757
accessed on 22/07/09.
Ehrenberg, R., & Brewer, D. (1994, March). Do school
and teacher characteristics matter?
Evidence from "High School and Beyond." Economics of
Education Review, 13(1), 1-17. (EJ 483 386)
Fafunwa, B. (1969). «The purpose of Teacher
Education» in Adaralegbe A. (Ed.) A Philosophy for Nigerian
Education, Ibadan. Heineman Educational Books (Nig.) Limited. P.
84.
Fafunwa, B. (1969). «The purpose of Teacher
Education» in Adaralegbe A. (Ed.) A Philosophy for Nigerian
Education, Ibadan. Heineman Educational Books (Nig.) Limited. P.
84.
Fagbamiye, E.O. (1977). «Inequalities in Nigerian
Educational Administration», Lagos Education Review. A Journal
of Studies in Education, vol. 1, April 1977.
Fagbamiye, E. O. (1977). Inequalities in Nigerian education
towards a genuine
revolution in education. Lagos Education Review, 1(1),
24-29
Fayemi, T.A. (1991). The effects of Instructional Resources on
the Learning of History in Selected Secondary Schools in Ogbomoso Local
Government. An Unpublished B.Ed Thesis.
Goldhaber, D., & Brewer, D. (2000, Summer). Does
teacher certification matter? High school teacher certification status and
student achievement. Educational Evaluation and Policy Analysis, 22(2),
129-145. (EJ 615 883)
Greenwald, R.H. & Laine, R. (1996, Fall). The effect
of school resources on student achievement. Review of Educational
Research, 66(3), 361-396. (EJ 596 389)
Grinnell, R. and Williams, M. (1990), Research in Social
Work, 1st Edition: Peacock Publishers Inc. New York.
Hanushek, E.A 1981. Throwing Money at Schools.
J. Analytical manage, 1:19-41.
Heneveld, W. & Craig, H. (1995). Schools count, World Bank
Technical paper No. 303.
Heneveld, W. (1994). Planning and monitoring the quality
of primary education in Sub-Saharan Africa. World Bank AFTHR Technical
Note No.14.
http//:
www.rnec.ac.rw Consulted on
15th March 2009 and on 10 February 2010
http://en.wikipedia.org/wiki/File:GasaboDist.png)
15th March 2009
http://www.kigalicity.gov.rw/IMG/bmp/KCC-Cells.bmp
accessed on 17th0ctober 2009
http://www.longislandschools.com/the-difference-between-public-schools-and-private-schools.aspx
Accessed on 15th March 2009
Hanushek, E. (1986, September). The economics of
schooling: Production and efficiency in public schools. Journal of
Economic Literature, 24(3), 1141-78.
International
Journal of Educational Research.
Volume
15, Issue 5, 1991, Pages 359-376 Retrieved at
www./sciencedirect.com/science/
accessed on 15/04/09
Investopedia (2010)
http://www.investopedia.com/terms/r/remuneration.asp
(Retrieved
18. Sept.2010)
Kadzamira, E. (2001). Research on school effects on students'
achievement in developing countries with special reference to Malawi:
Methodological issues. Zimbabwe Journal of Educational Research,
2(13), p.109-141.
Kerlinger, N.F. (1986), Foundation of Behavioral
Research, 3rd Edition, Holton Rechant and Wiston Inc. New York.
(Fort Woorht. Harcourt USA)
Kingdon, Geeta and Francis Teal. 2002. «Does
Performance Related Pay for Teachers Improve Student Performance? Some Evidence
From India.» Centre for the Study of African Economies Series Ref:
WPS/2002--06.Oxford University, Oxford.
Ministry of Finance and Economic Planning (2005), Poverty
Reduction Strategy. Annual Progress Report, Kigali (unpublished).
Momoh, S. (1980). A study of the relationship between
Instructional Resources and Academic Achievement of Students in Ilorin Local
Government Kwara State. An Unpublished M.Ed Thesis.
Moronfola, B. (1982). Effects of Instructional Resources
on the Academic Achievements of Secondary school Students in Ilorin Local
Government of Kwara State. Unpublished M.Ed Research Thesis.
Musaazi, J.C.S. (1982). The Theory and Practice of
Educational Administartion and planning. Macmillan London and
Basingstoke.
National Center for Education Statistics [NCES]. (2002).
Schools and Staffing Survey (SASS: 1999-2000).Washington D.C., USA.
Pakistan Journal of Social Sciences, (c) Medwell Journals,
2007 Retrieved at
http://www.medwellonline.net/fulltext/pjss/2007/616-619.pdf
accessed on 12.11.09
Research on Evaluation, Standards & Student Testing
(2009),
http://www.cse.ucla.edu/
Consulted on 15.09.2010
Popoola, T.A. (1980). An investigation into the
relationship between instructional resources and students academic performance
in Secondary Schools in Abeokuta Local Government Area of Ogun State of
Nigeria. An Unpublished M.Ed Thesis.
Sanders, W. 1999. «Teachers, teachers, teachers!»
Blueprint Magazine No. 4.
Salawu, I. O. & Adedapo, Y. A. (2001). Perception of
private secondary school teachers to the provision of teaching facilities in
schools as is result of wage increase. Journal of Professional Teacher
Trainers (JPTET), 3 (1&2), 156-163.
Thomas, H. 1990. Education Cost and Performance. A Cost
Effectiveness Analysis. London: Cassel Education Ltd.
Ukeje, D. O. (1970). «Performance Oriented Teacher
Education»: Report of the 5th Annual Conference, Western Council of
the Association for Teacher Education in Africa. P. 59.
Winkler Donald and Jacques Vander Gaag, (1996). Children
of the Poor in Latin America and the Caribbean. Paper no 1,
Lasch. Washington D.C: World bank.
World Bank. 2003. World Development Report 2004: Making
Services Work for Poor
People. World Bank, Washington D.C.
World Bank (2004). Education in Rwanda:Rebalancing
Resources to Accelerate Post-Conflict Development and Poverty Reduction.
World Bank, Washington D.C.
Weiner, B. (2000). Intrapersonal and interpersonal
theories of motivation from an
Attribution perspective. Educational Psychology
Review, 12, 1-14.
Murnane, R., Willett, J.,
& Levy, F. (1995, May). The Growing Importance of Cognitive Skills in
Wage Determination. The Review of Economics and Statistics, 77(2), 251-66.
Strauss, R., & Vogt, W. (2001, March). It's what you
know, not how you learned to teach it: Evidence from a study of the effects of
knowledge and pedagogy on student achievement. Paper presented at the
annual meeting of American Educational Finance Association, Cincinnati.
Walsh, K. (2001). Teacher Certification Reconsidered:
Stumbling for Quality. Baltimore, MD: Abell Foundation. (ED 460 100)
APPENDICES
APPENDIX A: TRANSMITTAL LETTER

FACULTY OF EDUCATION
OFFICE OF THE DEAN
Tuesday, September 15, 2009
TO WHOM IT MAY CONCERN
Dear Sir/Madam,
RESEARCH INTRODUCTION LETTER
Mr/Ms/Mrs Nzabihimana Damien Reg. no MED/19043/72/DF is a
student in the Faculty of Education. He is now carrying out a study about
«The Nature of Primary Schools and the Academic Performance of Pupils in
Gasabo District, Rwanda» as one of the requirements for the completion of
his/her studies towards a Master's degree in Educational Management and
Administration. He/She is thus introduced to you.
APPENDIX C: TIME FRAME
|
Activity
|
2009
|
2010
|
|
Feb.
|
Mar-Apr.
|
May-Sept.
|
Oct.
|
Nov.-Dec.
|
Jan.10-May.10
|
June
|
|
Topic identification
|
|
|
|
|
|
|
|
|
Research Proposal writing
|
|
|
|
|
|
|
|
|
Research Proposal submission &approval
|
|
|
|
|
|
|
|
|
Pre-testing of the research tools
|
|
|
|
|
|
|
|
|
Data collection
|
|
|
|
|
|
|
|
|
Data Analysis, interpretation of findings& Report
Writing
|
|
|
|
|
|
|
|
|
Report Editing & Report Submission
|
|
|
|
|
|
|
|
|
Presentation of the thesis
|
|
|
|
|
|
|
|
APPENDIX D: INTERVIEW GUIDE FOR
HEAD TEACHERS
1. To what extent are your teachers
qualified?
2. What is the average experience of
teachers?
3. What strategies do your teachers apply in preparing
for lessons
4. How are the teachers committed to pupils and their
learning
5. How do you rate your teachers in terms knowledge of
the subject they teach
6. How effective are your teachers in managing and
monitoring pupils learning
7. How does this school perform in PLE in general and
how has it performed in the last three years
8. In your point of view what can explain such
performance?
9. How do you compare teachers experience and pupils
performance
10. Are the teachers in your school satisfied of their
work and of the salary they get?
11. What pedagogical aids do you have at your school?
Are they enough compared to the quality of education you wish to
deliver?
12. To what extent do the parents and guardians of
your pupils collaborate with the school for the better education of their
children?
13. What is the absence rate for teachers in this
school?
14. What is the proportion rate of permanent
teachers?
15. What is the proportion of teachers who have other
occupations?
16. Has there been a staff meeting within the past 6
months?
17. How is the evaluation system in this school? Are
tests given weekly? Monthly? Per trimester? Occasionally? No test other than
regular exams?
APPENDIX E: QUESTIONNAIRE TO
TEACHERS
Instruction
Please put a tick mark (V) reflecting your response in
the space provided for this purpose.
To ensure the validity and reliability of data, you
are kindly requested to answer the questions as truthfully as possible and
according to your independent opinion.
You may or may not disclose your name.
SECTION A: BACKGROUND VARIABLES
School name:
School status:
Public/ private subsidized
Private
Respondent's names (optional):
Highest qualification:
Sex: Male
SECTION B: INDEPENDENT VARIABLE: TEACHER QUALITY
In this section please indicate the extent to which you agree
with the following statements. Your respective answers are to range from a
minimum of 1 (for strongly disagree) to a maximum of five (for strongly agree)
|
1 Preparation for class
|
|
1.1. I adequately prepare my self whenever I am going to
teach
|
1
|
2
|
3
|
4
|
5
|
|
I.2 I possess enough skills and competence in the teaching
profession
|
1
|
2
|
3
|
4
|
5
|
|
Teacher commitment to pupils and their learning
|
|
2.1. I believe all people can learn
|
1
|
2
|
3
|
4
|
5
|
|
2.2. I treat people equally and recognize individual
difference and cater for it while teaching
|
1
|
2
|
3
|
4
|
5
|
|
2.3. I adjust my teaching based on observation and knowledge
|
1
|
2
|
3
|
4
|
5
|
|
3. Teacher's Knowledge of the subject
|
|
3.1. I understand how my subject relate to other discipline
|
1
|
2
|
3
|
4
|
5
|
|
3.2. I develop pupils critical and analytical thinking
|
1
|
2
|
3
|
4
|
5
|
|
3.3. I understand the pre-conditions students have about the
subject I teach
|
1
|
2
|
3
|
4
|
5
|
|
3.4. I use multiple methods and techniques in teaching
|
1
|
2
|
3
|
4
|
5
|
|
3.5 I teach pupils how to pose and solve their own problems
|
1
|
2
|
3
|
4
|
5
|
|
4. Managing and monitoring pupils learning
|
|
4.1. I create an environment the engage pupils and use time
effectively
|
1
|
2
|
3
|
4
|
5
|
|
4.2. I am aware of effective and damaging instructional
practices
|
1
|
2
|
3
|
4
|
5
|
|
4.3. I am capable of explaining pupils results to parents
|
1
|
2
|
3
|
4
|
5
|
|
4.4. I set norm for pupils social interaction
|
1
|
2
|
3
|
4
|
5
|
|
5. Learning From Experience
|
|
5.1. I make decisions based on my experience
|
1
|
2
|
3
|
4
|
5
|
|
5.2. I am a life long learner
|
1
|
2
|
3
|
4
|
5
|
|
5.3. I think critically about my practice and employee new
theory
|
|
|
|
|
|
APPENDIX F: OBSERVATION
GUIDE/INVENTORY FOR EDUCATIONAL RESOURCES
|
Resource
|
School name /or code
|
..............
|
|
Items
|
Dds*
|
Spls*
|
|
Physical
|
Offices
|
|
|
|
Classrooms
|
|
|
|
Toilets
|
|
|
|
Classrooms
with electricity
|
|
|
|
Playgrounds
|
|
|
|
Laboratory
|
|
|
|
Clinical room
|
|
|
|
Craft room
|
|
|
|
Staff room
|
|
|
|
Library
|
|
|
|
Computer room
|
|
|
|
Material
|
Chairs
|
|
|
|
Tables
|
|
|
|
Suitable desks
|
|
|
|
Projectors
|
|
|
|
Text Books &other reading materials
|
|
|
|
Computers
|
|
|
|
Computers with internet connection
|
|
|
|
Printer
|
|
|
|
Maps
|
|
|
|
Charts
|
|
|
|
TVs
|
|
|
|
Radios
|
|
|
|
School buses
|
|
|
|
Photocopier
|
|
|
|
Human
|
Enrolment
|
|
|
|
Class size*
|
|
|
|
Qualified Teachers
|
|
|
|
Counseling officers
|
|
|
|
School nurses
|
|
|
|
Administrators
|
|
|
|
Supporting Staff
|
|
|
|
Financial
|
Budget
|
|
|
APPENDIX G: MAP OF KIGALI PROVINCE
SHOWING LOCATION OF GASABO DISTRICT
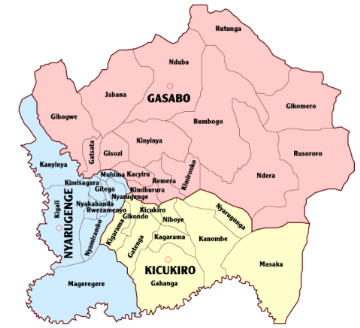
Source:
http://www.kigalicity.gov.rw/IMG/bmp/KCC-Cells.bmp
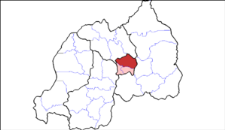
NB: on the map above, Gasabo is in
red.
Source:
http://en.wikipedia.org/wiki/File:GasaboDist.png)
APPENDIX H: TOP 10
PERFORMERS - P6 Acad. Year 2008
|
|
|
S.NoReg.NumberNameSchool NameDistrict
NameAggregate101020703081ELVIS IAN SEKAMANA MANZILA
COLOMBIEREGASABO3204030308037PATRICK
NSENGUMUREMYISONRISEMUSANZE3301020703090CYNTHIA UMUHOZALA
COLOMBIEREGASABO3401020903076QUEEN MUTESIKIGALI PARENTSGASABO3504030308001JEAN
PIERRE AKINGEYESONRISEMUSANZE3601021003027LUC DAVY
MUGANGAL'HORIZONGASABO3701020703003LISE JANICE ARAKAZALA
COLOMBIEREGASABO3801020801010IRAGUKUJIJE PEACE BONERABOSEECOLE
INTERNATIONALEGASABO3901020703013JACQUES GASHUGI TUBIBUKELA
COLOMBIEREGASABO31001021003010HERVE IRADUKUNDA RURANGWAL'HORIZONGASABO3
|
Source:
www.rnec.ac.rw.
APPENDIX I: TOP 10 PERFORMERS - P6
Acad. Year 2009
|
S.No
|
Reg.Number
|
Name
|
SchoolName
|
DistrictName
|
Aggregate
|
|
1
|
01020903095
|
ERIC MUTSINZI
|
KIGALI PARENTS
|
GASABO
|
5
|
|
2
|
01020903054
|
ARSENE KWITONDA
|
KIGALI PARENTS
|
GASABO
|
5
|
|
3
|
01020903071
|
FRED MUGISHA
|
KIGALI PARENTS
|
GASABO
|
5
|
|
4
|
01020903086
|
INAS BENNY MUSONI
|
KIGALI PARENTS
|
GASABO
|
5
|
|
5
|
01020903140
|
HOPE UMUZIGA
|
KIGALI PARENTS
|
GASABO
|
5
|
|
6
|
01020903144
|
ANGELLA UWASE RANGIRA
|
KIGALI PARENTS
|
GASABO
|
5
|
|
7
|
01020903157
|
. UWERA NINA NTAGANZWA KARAKE
|
KIGALI PARENTS
|
GASABO
|
5
|
|
8
|
01020903096
|
NOBLE MUYENZIKAZI
|
KIGALI PARENTS
|
GASABO
|
5
|
|
9
|
01020903149
|
OLIVIA UWASE
|
KIGALI PARENTS
|
GASABO
|
5
|
|
10
|
01020903069
|
BRANDON MUGANGA
|
KIGALI PARENTS
|
GASABO
|
5
|
Source:
www.rnec.ac.rw.
APPENDIX J Marks for the 300 pupils from the 10
sampled schools (2005 -2007)
|
Public Schools
|
Private Schools
|
|
Academic year & school code
|
To 10 performers of the school
|
Marks   ) )
|
Academic year & school code
|
Private schools
|
Marks

|
|
A 2007
|
|
1. 65.3
|
AA 2007
|
|
1. 62.3
|
|
2. 53.3
|
|
2. 60
|
|
3. 53.3
|
|
3. 59.7
|
|
4. 52.3
|
|
4. 58.7
|
|
5. 49.3
|
|
5. 58.3
|
|
6. 49.3
|
|
6. 58.3
|
|
7. 48
|
|
7. 58
|
|
8. 47.7
|
|
8. 56.3
|
|
9. 47.3
|
|
9. 56
|
|
10. 46
|
|
10. 55
|
|
B
|
|
1. 53.7
|
BB
|
|
1. 77.3
|
|
2. 52
|
|
2. 75.3
|
|
3. 51.7
|
|
3. 69.7
|
|
4. 50.7
|
|
4. 65.7
|
|
5. 49
|
|
5. 60
|
|
6. 48.7
|
|
6. 59
|
|
7. 47.7
|
|
7. 57.7
|
|
8. 47.7
|
|
8. 57.3
|
|
9. 47.3
|
|
9. 56
|
|
10. 46.7
|
|
10. 55.7
|
|
C
|
|
1. 60
|
CC
|
|
1. 91.3
|
|
2. 57.7
|
|
2. 89
|
|
3. 55.3
|
|
3. 87.3
|
|
4. 55
|
|
4. 86.3
|
|
5. 54.3
|
|
5. 84
|
|
6. 54.3
|
|
6. 82.3
|
|
7. 53.7
|
|
7. 81.7
|
|
8. 53.3
|
|
8. 79.7
|
|
9. 51.3
|
|
9. 76.3
|
|
10. 50.7
|
|
10. 75.3
|
|
D
|
|
1. 74.7
|
DD
|
|
1. 81.7
|
|
2. 74.3
|
|
2. 79.7
|
|
3. 70.3
|
|
3. 76
|
|
4. 63.7
|
|
4. 74
|
|
5. 63
|
|
5. 74
|
|
6. 62.7
|
|
6. 72.7
|
|
7. 61
|
|
7. 72
|
|
8. 59.7
|
|
8. 71.3
|
|
9. 58.7
|
|
9. 71
|
|
10. 57.7
|
|
10. 68.3
|
|
E
|
|
1. 69
|
EE
|
|
1. 78.7
|
|
2. 65.3
|
|
2. 78.7
|
|
3. 63.3
|
|
3. 77.7
|
|
4. 61.7
|
|
4. 75.7
|
|
5. 60.3
|
|
5. 74.3
|
|
6. 55
|
|
6. 73.7
|
|
7. 55
|
|
7. 73.7
|
|
8. 54
|
|
8. 73
|
|
9. 53.7
|
|
9. 72
|
|
10. 52
|
|
10. 68.3
|
|
A 2006
|
|
1. 66
|
AA 2006
|
|
1. 70.7
|
|
2. 65.7
|
|
2. 70
|
|
3. 64.3
|
|
3. 64
|
|
4. 64.3
|
|
4. 63.7
|
|
5. 61
|
|
5. 63
|
|
6. 60
|
|
6. 62.3
|
|
7. 59.3
|
|
7. 62
|
|
8. 57.7
|
|
8. 60.7
|
|
9. 57.7
|
|
9. 60.7
|
|
10. 55.7
|
|
10. 58.3
|
|
B
|
|
1. 81.7
|
BB
|
|
1. 82
|
|
2. 70.3
|
|
2. 78.3
|
|
3. 65.7
|
|
3. 78.3
|
|
4. 58.7
|
|
4. 72.7
|
|
5. 56.3
|
|
5. 72.7
|
|
6. 56
|
|
6. 71.3
|
|
7. 54.7
|
|
7. 71
|
|
8. 54.7
|
|
8. 70
|
|
9. 54.3
|
|
9. 69
|
|
10. 54.3
|
|
10. 68.3
|
|
C
|
|
1. 68.7
|
CC
|
|
1. 90
|
|
2. 68.3
|
|
2. 89.3
|
|
3. 67
|
|
3. 89
|
|
4. 64.3
|
|
4. 87.3
|
|
5. 63.3
|
|
5. 85.3
|
|
6. 63.3
|
|
6. 85
|
|
7. 62.7
|
|
7. 84.3
|
|
8. 60.7
|
|
8. 83.3
|
|
9. 57.3
|
|
9. 82.7
|
|
10. 56.7
|
|
10. 82.3
|
|
D
|
|
1. 76
|
DD
|
|
1. 88.7
|
|
2. 75.7
|
|
2. 85
|
|
3. 75
|
|
3. 84
|
|
4. 73.7
|
|
4. 83.7
|
|
5. 72
|
|
5. 82.3
|
|
6. 68
|
|
6. 82
|
|
7. 67
|
|
7. 81.7
|
|
8. 66.3
|
|
8. 81.7
|
|
9. 66
|
|
9. 81.3
|
|
10. 65.7
|
|
10. 81
|
|
E
|
|
1. 66.7
|
EE
|
|
1. 62.3
|
|
2. 65.7
|
|
2. 62.0
|
|
3. 63.3
|
|
3. 58.7
|
|
4. 59.0
|
|
4. 57.7
|
|
5. 57.0
|
|
5. 52.7
|
|
6. 56.3
|
|
6. 52.7
|
|
7. 56.3
|
|
7. 52.0
|
|
8. 55.7
|
|
8. 51.0
|
|
9. 54.0
|
|
9. 50.3
|
|
10. 53.7
|
|
10. 47.3
|
|
A 2005
|
|
1. 60.0
|
AA 2005
|
|
1. 71.7
|
|
2. 58.3
|
|
2. 71.7
|
|
3. 57.0
|
|
3. 71.3
|
|
4. 56.3
|
|
4. 71.3
|
|
5. 55.7
|
|
5. 67
|
|
6. 55.7
|
|
6. 67
|
|
7. 55.3
|
|
7. 66.7
|
|
8. 54.7
|
|
8. 66.7
|
|
9. 54.3
|
|
9. 61
|
|
10. 54.0
|
|
10. 61
|
|
B
|
|
1. 72.7
|
BB
|
|
1. 81.3
|
|
2. 61
|
|
2. 80.7
|
|
3. 61
|
|
3. 79.7
|
|
4. 60.7
|
|
4. 78.7
|
|
5. 60.3
|
|
5. 70
|
|
6. 59.3
|
|
6. 69.3
|
|
7. 59.3
|
|
7. 67.7
|
|
8. 59
|
|
8. 67
|
|
9. 57
|
|
9. 67
|
|
10. 55.7
|
|
10. 66.7
|
|
C
|
|
1. 72.3
|
CC
|
|
1. 93.3
|
|
2. 72
|
|
2. 91.3
|
|
3. 66.7
|
|
3. 88.0
|
|
4. 66
|
|
4. 87.7
|
|
5. 65.3
|
|
5. 87.3
|
|
6. 61
|
|
6. 86.3
|
|
7. 60.7
|
|
7. 85.0
|
|
8. 58.3
|
|
8. 85.0
|
|
9. 58
|
|
9. 83.7
|
|
10. 57.3
|
|
10. 83.3
|
|
D
|
|
1. 79
|
DD
|
|
1. 83.0
|
|
2. 77
|
|
2. 81.7
|
|
3. 77
|
|
3. 79.3
|
|
4. 73
|
|
4. 79.3
|
|
5. 72
|
|
5. 77.7
|
|
6. 72
|
|
6. 76.7
|
|
7. 71.7
|
|
7. 76.0
|
|
8. 71.3
|
|
8. 75.3
|
|
9. 70.3
|
|
9. 74.3
|
|
10. 70.3
|
|
10. 74.0
|
|
E
|
|
1. 79
|
EE
|
|
1. 89.3
|
|
2. 78.3
|
|
2. 83.7
|
|
3. 74.3
|
|
3. 83.7
|
|
4. 69
|
|
4. 83.7
|
|
5. 66.7
|
|
5. 82.7
|
|
6. 66.3
|
|
6. 82
|
|
7. 65
|
|
7. 81.3
|
|
8. 64.7
|
|
8. 80.7
|
|
9. 64.3
|
|
9. 79
|
|
10. 63.7
|
|
10. 77
|
|
N
|
150
|
|
150
|
|
Mean
|
61.07511
|
|
73.4
|
|
Variance
|
65.40607
|
|
114.7948
|
|
SD
|
8.087402
|
|
10.71423
|
|
P. value
|
1.4966E-24
|


