3.2 Sample processing
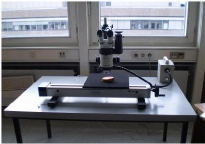
The stem discs were polished successively with different bands
using a polishing machine (Picture 8). The band of 80 um was first used and
followed by grains of 120, 240, 400 and 600 um. After this step, the wood dust
was cleaned from sample surface with electrical air pump. These applications
helped us to make good macroscopic observation s of the rings boundaries
(Figure 1). The different rings of each disc sample were then marked using a
pencil. A magnifying glass was sometimes used to identify the ring when the
macroscopic observation was not easy.

Picture 8: The used polishing machine
3.3 Method used to study the wood anatomy
Before describing the wood structure, we defined some criteria
that were mostly based on wood structure following cell types: vessel elements
and its distribution, disposition of rays and parenchyma cells. For that, we
referred to Coster (1927, 1928), Worbes (2002) and Shöngart (2006).
Following these criteria, the macroscopic and microscopic observations were
done using a scanner and the Leica software with magn ifying glass and
microscope.
3.4 Method used to study the growth performance s
The growth performances were mostly based on the age of trees,
ring increment and the initial growing in height. They helped to assess the
differences between the species. To determine the age of each sampled tree, the
rings were easily counted visually. However, all measurements (tree ring
counting and ring width measurement) were done with high accuracy using
electronic microscope and Lintab (Picture 9). The number of rings identified on
wood discs cutted at 10 cm from ground indicates after a cross dating, the age
of specified tree. The number of years needed by the targeted trees to reach
the breast height (1.3 m) was determined making a difference between the
numbers of observed rings on two stems discs (the stem disc cutted at 10 cm
from ground and the one cutted at 1.3 m) from a same tree completed by cross
dating.
Tree-rings widths were measured using the software TSAPWin by
digital measuring device Lintab 5, Factor: 1, 00 and using 1/100 mm as Length
unit, COM port 4 and PC Mouse. To compare the variation in growth performances
between species, the data on the ages and mean annual ring increment (MRI) were
analysed with statistical approach. The test of ANOVA followed by
Student-Newman-Keuls was used after a logarithmic transformation to stabilize
the variance and normalize the data.
Picture 9: The Lintab combined to microscope for
measurement
3.5 Cross-dating
Cross dating of time series was used for the verification of the
series and the elimination of possible errors and to find the correct dated
position in time.
It helped in the elimination of measurement errors, e.g. the
removal of «false rings» and the insertion of «missing
rings». TSAP-Win offered a combination of both visual (graphical)
and statistical cross-dating. Statistical models are excellent tools to find
possible matches or to verify the dates of pre-dated time series.
In dendrochronology two main concepts are used to express the
quality of accordance between time series: Gleichlaeufigkeit and/or t -values.
While the t-statistic is a widely known test for mean difference significance,
Gleichlaeufigkeit was developed as a special tool for cross-dating of tree-ring
series (Eckstein & Bauch, 1969). These concepts are characterized
by a different sensitivity to tree-ring patterns. While Gleichlaeufigkeit
represents the overall accordance of two series, t-values are sensitive to
extreme values, such as event years. A combination of both is realized in the
Cross-Dating Index (CDI) that was used in this study
to obtain the exact year in witch each tree ring was formed
and also for matching variation in ring width among several tree rings series.
To identify real age of each tree, the cross -dating was done between the two
series time of the stem disc cut at 10 cm from ground and the other one felt at
1.3 m of height. However, for samples cutted only in one level of tree (level
1), it was done between different trees of the same species and from the same
stand.
| 

