ANNEXE 6 (COINTEGRATION TEST)
Date: 11/29/11 Time: 18:57
Sample (adjusted): 1981 2009
Included observations: 29 after adjustments
Trend assumption: No deterministic trend (restricted
constant)
Series: LPIB LDO LCAP LIPIB LIPC POP
Lags interval (in first differences): No lags
Unrestricted Cointegration Rank Test (Trace)
|
Hypothesized
No. of CE(s)
|
Eigenvalue
|
Trace
Statistic
|
0.05
Critical Value
|
Prob.**
|
|
None *
|
0.997487
|
273.2205
|
103.8473
|
0.0000
|
|
At most 1 *
|
0.791070
|
99.62252
|
76.97277
|
0.0004
|
|
At most 2 *
|
0.595991
|
54.21565
|
54.07904
|
0.0486
|
|
At most 3
|
0.480437
|
27.93242
|
35.19275
|
0.2443
|
|
At most 4
|
0.193302
|
8.944189
|
20.26184
|
0.7415
|
|
At most 5
|
0.089366
|
2.714815
|
9.164546
|
0.6352
|
Trace test indicates 3 cointegrating eqn(s) at the 0.05 level *
denotes rejection of the hypothesis at the 0.05 level **MacKinnon-Haug-Michelis
(1999) p-values
Réalisé et soutenu par .T1NOUJvfENOU
3-(ypolite & 3-(OUNX.TNRIN Jvf. gélicien Page L
.Tnalyse de l~impact des investissements
publics dans le secteur agricole sur la croissance
économique au
Bénin
ANNEXE 7 (MODELE A CORRECTION D'ERREUR)
Dependent Variable: D(LPIB)
Method: Least Squares
Date: 11/29/11 Time: 19:11
Sample (adjusted): 1982 2009
Included observations: 28 after adjustments
|
Variable
|
Coefficient
|
Std. Error t-Statistic
|
Prob.
|
|
C
|
-1.010436
|
0.833999 -1.211555
|
0.2423
|
|
D(LDO)
|
-0.006853
|
0.154568 -0.044334
|
0.9652
|
|
D(LCAP)
|
-0.020660
|
0.011469 -1.801271
|
0.0894
|
|
D(LIPIB)
|
0.057361
|
0.036316 1.579497
|
0.1326
|
|
D(POP,2)
|
-0.011947
|
0.030163 -0.396097
|
0.6970
|
|
D(LIPC)
|
-0.150954
|
0.191659 -0.787615
|
0.4418
|
|
LPIB(-1)
|
-0.760403
|
0.153235 -4.962333
|
0.0001
|
|
LDO(-1)
|
-0.208130
|
0.131521 -1.582485
|
0.1320
|
|
LCAP(-1)
|
-0.093336
|
0.058026 -1.608506
|
0.1261
|
|
LIPIB(-1)
|
0.042320
|
0.030333 1.395214
|
0.1809
|
|
LPOP(-1)
|
1.263577
|
0.277015 4.561399
|
0.0003
|
|
R-squared
|
0.684861
|
Mean dependent var
|
0.054841
|
|
Adjusted R-squared
|
0.499484
|
S.D. dependent var
|
0.064589
|
|
S.E. of regression
|
0.045695
|
Akaike info criterion
|
-3.046936
|
|
Sum squared resid
|
0.035496
|
Schwarz criterion
|
-2.523570
|
|
Log likelihood
|
53.65710
|
F-statistic
|
3.694437
|
|
Durbin-Watson stat
|
1.065769
|
Prob(F-statistic)
|
0.008766
|
Réalisé et soutenu par .T1NOUJvfENOU
3-(ypolite & 3-(OUNX.TNRIN Jvf. gélicien Page M
.Tnalyse de l~impact des investissements
publics dans le secteur agricole sur la croissance
économique au
Bénin
ANNEXE 8 (TEST CLASSIQUE SUR LE MODELE)
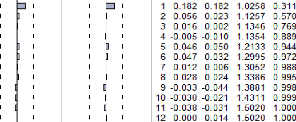
test du correlogramme


Test de normalité

Test de White
White Heteroskedasticity Test:
F-statistic 1.230306 Probability 0.412731
Obs*R-squared 21.79867 Probability 0.351535
Test d'omission de variable
Réalisé et soutenu par.41NOUN1ENO2l ypolite
! OUTI".TVR#N Jvf$ %éliicien Page N
.Analyse de Cimpact des investissements publics dans Ce
secteur agricole sur la croissance
économique au
Bénin
Ramsey RESET Test:
F-statistic 3.538228 Probability 0.055108
Log likelihood ratio 10.82092 Probability 0.004470
Test de STABILITE

TEST DE PREVISION

Realise et soutenu par AWOUN1ENO'U ypoCite ! OW~".TVR#N
Jvf$ %éCicien Page O
.Analyse de Cimpact des investissements pu6Cics dans Ce
secteur agricoCe sur Ça croissance
économique au
Bénin

Realise et soutenu par AWOUN1ENO'U ypoCite ! OW~".TVR#N
Jvf$ %éCicien Page P
.Analyse de Cimpact des investissements pu6Cics dans Ce
secteur agricoCe sur Ça croissance
économique au
Bénin

Realise et soutenu par AWOUN1ENO'U ypoCite ! OW~".TVR#N
Jvf$ %éCicien Page Q
.Analyse de Cimpact des investissements pu6Cics dans Ce
secteur agricoCe sur Ça croissance
économique au
Bénin

| 


