3.4.2.5 Housing density
High density housing poses serious threats to human health by
forming sinks for outdoor pollutants, which is aggravated by the fact that the
houses are not well-ventilated (Ezatti et al. 2005, YTV 2007). Housing density
also makes up the primary source of indoor pollution due to unsafe human
excreta disposal, and household fuel consumption (Ezatti et al. 2005).
Consequently these unsafe settlements with poor environmental quality expose
their residents to social instability and communicable and non-communicable
diseases, such as skin and eyes infections, diarrhea, respiratory infections
and environmental hazards (WHO 2001a). Slums populate different locations of
Port-au-Prince's sea coast, built on and in unstable, stinky and unhealthy
waste, in the dust or in the mud. They are called «Brooklyn» or
«Manhattan», using a supreme sense of the sarcasm (Wargny, 2004).
We acknowledge that housing density embodies both aspects of
hazards and vulnerability. Though present as a vulnerability factor in almost
all the variables considered, and acting as the main trigger of the different
risks considered, it was suitable to reduce the redundancy that would result by
adding it each time. We use the term risk for the reason stated above that
housing density represents a factor of air pollution hazard and at the same
time a vulnerability feature. That is, even if there is no other risk factor
present in a location, high and very high housing density are deemed sufficient
conditions for the existence of high risk in these places.
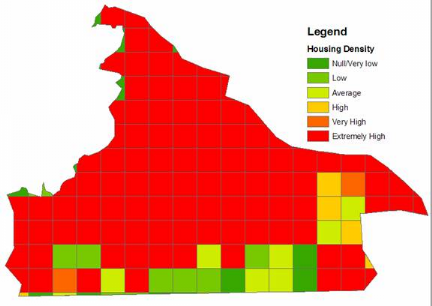
Housing density was originally based on a grid 0.5x0.5 kilometers
in size, which classified density in 6 categories from null to extremely high
(Table 4). Though it was unclear what theoretical background this
categorization was based upon, it was found inappropriate to use it in this
study. A first example of this inconvenience provided in Figure 2 indicates
that extremely high density represents more than 72% of the area, including
slums, commercial and residential neighborhoods. Another illustration is that
the difference between average and very high density is only 6 houses per
km2. Hence it was too general and would not allow us to discriminate
neighborhoods with environmental patterns significant for health assessment.
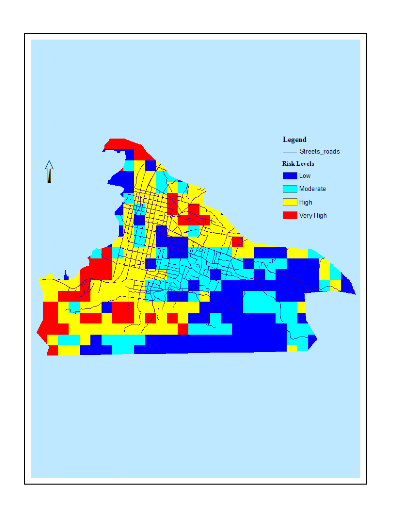
Then a grid of higher resolution (0.3x0.3 km, Figure 3) was generated. This
was manually reclassified based on SDE count of housing published by IHSI and
with the assistance of a live image from Google Earth, which clearly displayed
the density difference. Table 5 provides a summary of risk levels associated
with different thresholds of housing density.
Table 4: Housing Density
classification in the original grid
|
Values
|
Density Level
|
|
0
|
Null/Very Low
|
|
1
|
Low
|
|
2-5
|
Average
|
|
6-10
|
High
|
|
11-23
|
Very High
|
|
65 - 300
|
Extremely High
|
|

![]()
Figure 2: Housing Density
as classified in the original grid 0.5x0.5 km
|

Figure 3: Housing Density
after reclassification (grid size: 0.3x0.3 km)
|
Table 5: Housing Density and Risk Levels
|
Housing Density
|
Risk Levels
|
|
Low (1-2)
|
Low (1)
|
|
Medium (3)
|
Moderate (2)
|
|
High (4)
|
High (3)
|
|
Very High - Extreme (5-6)
|
Extreme (4)
|
| 


